Pakistani vs Immigrants from Albania Average Family Size
COMPARE
Pakistani
Immigrants from Albania
Average Family Size
Average Family Size Comparison
Pakistanis
Immigrants from Albania
3.22
AVERAGE FAMILY SIZE
33.7/ 100
METRIC RATING
189th/ 347
METRIC RANK
3.16
AVERAGE FAMILY SIZE
1.3/ 100
METRIC RATING
260th/ 347
METRIC RANK
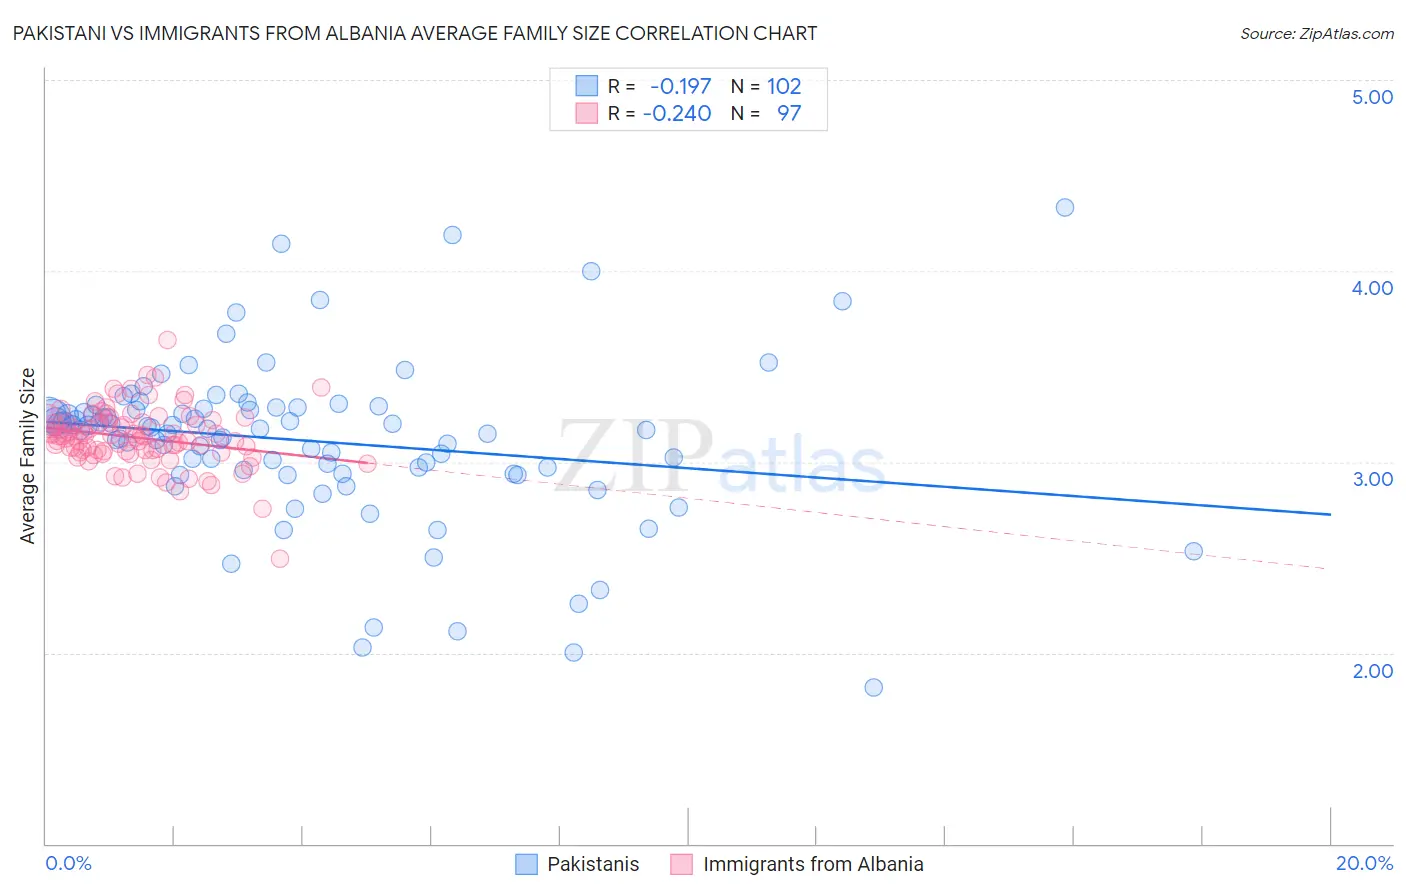
Pakistani vs Immigrants from Albania Average Family Size Correlation Chart
The statistical analysis conducted on geographies consisting of 335,179,605 people shows a poor negative correlation between the proportion of Pakistanis and average family size in the United States with a correlation coefficient (R) of -0.197 and weighted average of 3.22. Similarly, the statistical analysis conducted on geographies consisting of 119,382,596 people shows a weak negative correlation between the proportion of Immigrants from Albania and average family size in the United States with a correlation coefficient (R) of -0.240 and weighted average of 3.16, a difference of 1.7%.
Average Family Size Correlation Summary
| Measurement | Pakistani | Immigrants from Albania |
| Minimum | 1.82 | 2.49 |
| Maximum | 4.33 | 3.64 |
| Range | 2.51 | 1.15 |
| Mean | 3.11 | 3.13 |
| Median | 3.17 | 3.13 |
| Interquartile 25% (IQ1) | 2.96 | 3.05 |
| Interquartile 75% (IQ3) | 3.28 | 3.21 |
| Interquartile Range (IQR) | 0.32 | 0.16 |
| Standard Deviation (Sample) | 0.42 | 0.16 |
| Standard Deviation (Population) | 0.42 | 0.16 |
Similar Demographics by Average Family Size
Demographics Similar to Pakistanis by Average Family Size
In terms of average family size, the demographic groups most similar to Pakistanis are Burmese (3.22, a difference of 0.060%), Immigrants from Zaire (3.22, a difference of 0.070%), Immigrants from Eastern Africa (3.22, a difference of 0.080%), Thai (3.22, a difference of 0.090%), and Immigrants from Israel (3.22, a difference of 0.090%).
| Demographics | Rating | Rank | Average Family Size |
| Moroccans | 44.2 /100 | #182 | Average 3.22 |
| Immigrants | Northern Africa | 41.7 /100 | #183 | Average 3.22 |
| Immigrants | Eastern Asia | 40.8 /100 | #184 | Average 3.22 |
| Immigrants | Sri Lanka | 39.8 /100 | #185 | Fair 3.22 |
| Immigrants | Argentina | 39.8 /100 | #186 | Fair 3.22 |
| Immigrants | Malaysia | 39.0 /100 | #187 | Fair 3.22 |
| Thais | 38.3 /100 | #188 | Fair 3.22 |
| Pakistanis | 33.7 /100 | #189 | Fair 3.22 |
| Burmese | 31.0 /100 | #190 | Fair 3.22 |
| Immigrants | Zaire | 30.5 /100 | #191 | Fair 3.22 |
| Immigrants | Eastern Africa | 30.1 /100 | #192 | Fair 3.22 |
| Immigrants | Israel | 29.3 /100 | #193 | Fair 3.22 |
| Immigrants | Sudan | 29.1 /100 | #194 | Fair 3.22 |
| Choctaw | 28.3 /100 | #195 | Fair 3.21 |
| Senegalese | 28.2 /100 | #196 | Fair 3.21 |
Demographics Similar to Immigrants from Albania by Average Family Size
In terms of average family size, the demographic groups most similar to Immigrants from Albania are Potawatomi (3.16, a difference of 0.0%), Turkish (3.16, a difference of 0.010%), Immigrants from North Macedonia (3.16, a difference of 0.010%), Immigrants from Russia (3.16, a difference of 0.010%), and Albanian (3.17, a difference of 0.060%).
| Demographics | Rating | Rank | Average Family Size |
| South Africans | 1.7 /100 | #253 | Tragic 3.17 |
| Immigrants | Hungary | 1.7 /100 | #254 | Tragic 3.17 |
| Cape Verdeans | 1.6 /100 | #255 | Tragic 3.17 |
| Immigrants | Kazakhstan | 1.5 /100 | #256 | Tragic 3.17 |
| Albanians | 1.5 /100 | #257 | Tragic 3.17 |
| Turks | 1.3 /100 | #258 | Tragic 3.16 |
| Potawatomi | 1.3 /100 | #259 | Tragic 3.16 |
| Immigrants | Albania | 1.3 /100 | #260 | Tragic 3.16 |
| Immigrants | North Macedonia | 1.3 /100 | #261 | Tragic 3.16 |
| Immigrants | Russia | 1.3 /100 | #262 | Tragic 3.16 |
| Immigrants | Bulgaria | 1.0 /100 | #263 | Tragic 3.16 |
| Americans | 1.0 /100 | #264 | Tragic 3.16 |
| Immigrants | South Africa | 0.9 /100 | #265 | Tragic 3.16 |
| Immigrants | Greece | 0.9 /100 | #266 | Tragic 3.16 |
| Iroquois | 0.8 /100 | #267 | Tragic 3.16 |