Syrian vs U.S. Virgin Islander Average Family Size
COMPARE
Syrian
U.S. Virgin Islander
Average Family Size
Average Family Size Comparison
Syrians
U.S. Virgin Islanders
3.19
AVERAGE FAMILY SIZE
6.5/ 100
METRIC RATING
224th/ 347
METRIC RANK
3.29
AVERAGE FAMILY SIZE
98.8/ 100
METRIC RATING
96th/ 347
METRIC RANK
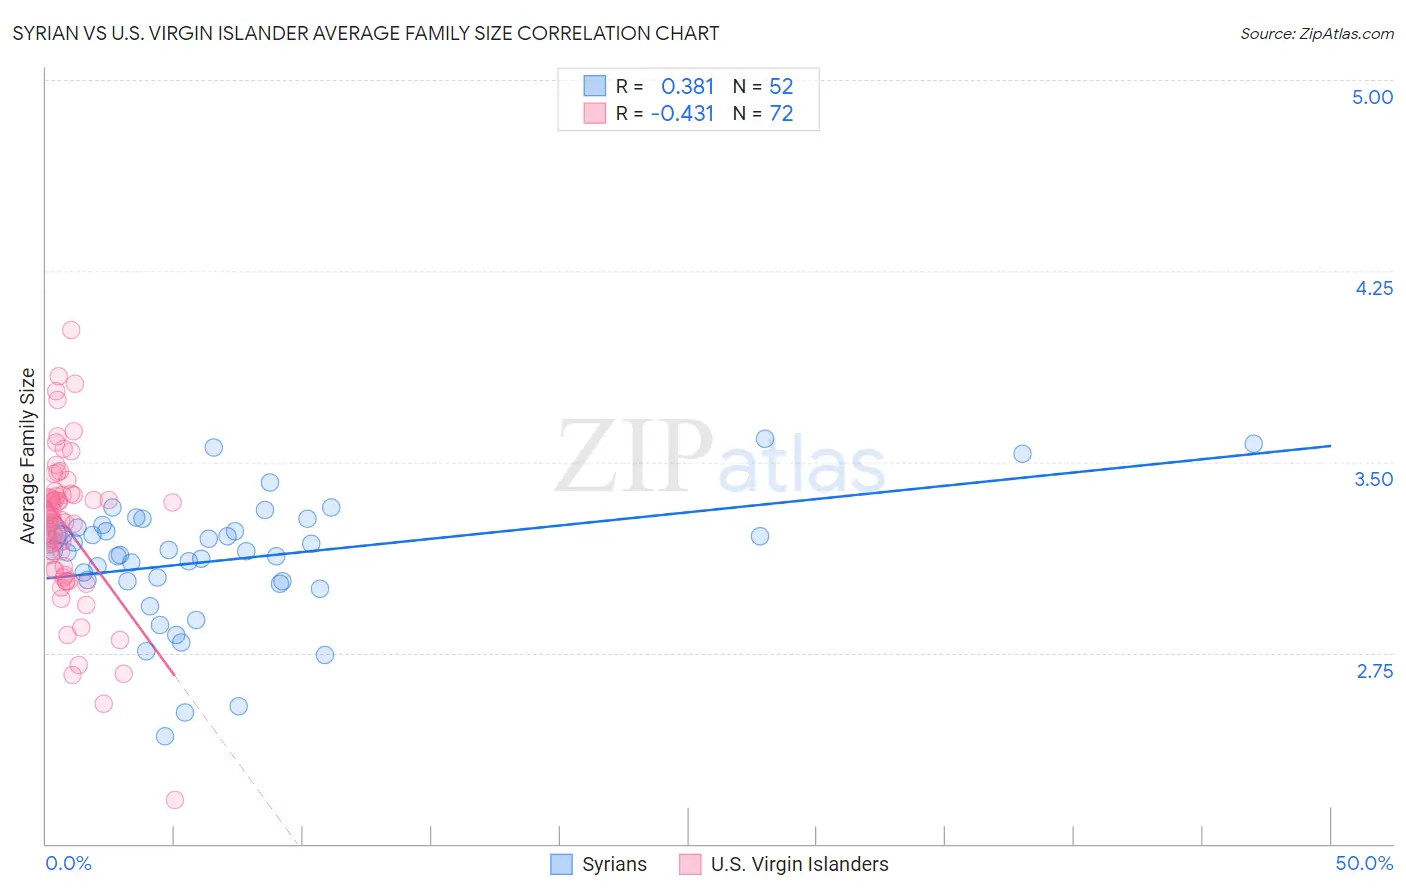
Syrian vs U.S. Virgin Islander Average Family Size Correlation Chart
The statistical analysis conducted on geographies consisting of 266,181,875 people shows a mild positive correlation between the proportion of Syrians and average family size in the United States with a correlation coefficient (R) of 0.381 and weighted average of 3.19. Similarly, the statistical analysis conducted on geographies consisting of 87,507,759 people shows a moderate negative correlation between the proportion of U.S. Virgin Islanders and average family size in the United States with a correlation coefficient (R) of -0.431 and weighted average of 3.29, a difference of 3.3%.
Average Family Size Correlation Summary
| Measurement | Syrian | U.S. Virgin Islander |
| Minimum | 2.42 | 2.17 |
| Maximum | 3.59 | 4.02 |
| Range | 1.17 | 1.85 |
| Mean | 3.12 | 3.24 |
| Median | 3.15 | 3.27 |
| Interquartile 25% (IQ1) | 3.03 | 3.08 |
| Interquartile 75% (IQ3) | 3.23 | 3.37 |
| Interquartile Range (IQR) | 0.20 | 0.29 |
| Standard Deviation (Sample) | 0.25 | 0.30 |
| Standard Deviation (Population) | 0.24 | 0.30 |
Similar Demographics by Average Family Size
Demographics Similar to Syrians by Average Family Size
In terms of average family size, the demographic groups most similar to Syrians are Cree (3.19, a difference of 0.020%), Immigrants from Zimbabwe (3.19, a difference of 0.040%), Chickasaw (3.19, a difference of 0.040%), Portuguese (3.19, a difference of 0.040%), and Immigrants from Ukraine (3.19, a difference of 0.050%).
| Demographics | Rating | Rank | Average Family Size |
| Immigrants | Somalia | 10.3 /100 | #217 | Poor 3.20 |
| French American Indians | 9.8 /100 | #218 | Tragic 3.20 |
| Pennsylvania Germans | 9.3 /100 | #219 | Tragic 3.19 |
| Lebanese | 9.1 /100 | #220 | Tragic 3.19 |
| Immigrants | Ukraine | 7.2 /100 | #221 | Tragic 3.19 |
| Immigrants | Kuwait | 7.2 /100 | #222 | Tragic 3.19 |
| Immigrants | Zimbabwe | 7.1 /100 | #223 | Tragic 3.19 |
| Syrians | 6.5 /100 | #224 | Tragic 3.19 |
| Cree | 6.2 /100 | #225 | Tragic 3.19 |
| Chickasaw | 6.0 /100 | #226 | Tragic 3.19 |
| Portuguese | 6.0 /100 | #227 | Tragic 3.19 |
| Immigrants | Nonimmigrants | 5.7 /100 | #228 | Tragic 3.19 |
| Immigrants | Italy | 5.3 /100 | #229 | Tragic 3.19 |
| Icelanders | 5.2 /100 | #230 | Tragic 3.19 |
| Basques | 5.2 /100 | #231 | Tragic 3.19 |
Demographics Similar to U.S. Virgin Islanders by Average Family Size
In terms of average family size, the demographic groups most similar to U.S. Virgin Islanders are Immigrants from Oceania (3.29, a difference of 0.040%), Barbadian (3.29, a difference of 0.040%), Nigerian (3.29, a difference of 0.050%), Guamanian/Chamorro (3.29, a difference of 0.050%), and Immigrants from Burma/Myanmar (3.29, a difference of 0.070%).
| Demographics | Rating | Rank | Average Family Size |
| Malaysians | 99.6 /100 | #89 | Exceptional 3.31 |
| Menominee | 99.4 /100 | #90 | Exceptional 3.30 |
| Immigrants | Pakistan | 99.2 /100 | #91 | Exceptional 3.30 |
| Immigrants | Cameroon | 99.2 /100 | #92 | Exceptional 3.30 |
| Peruvians | 99.2 /100 | #93 | Exceptional 3.30 |
| Sierra Leoneans | 99.0 /100 | #94 | Exceptional 3.30 |
| Immigrants | Lebanon | 99.0 /100 | #95 | Exceptional 3.30 |
| U.S. Virgin Islanders | 98.8 /100 | #96 | Exceptional 3.29 |
| Immigrants | Oceania | 98.7 /100 | #97 | Exceptional 3.29 |
| Barbadians | 98.6 /100 | #98 | Exceptional 3.29 |
| Nigerians | 98.6 /100 | #99 | Exceptional 3.29 |
| Guamanians/Chamorros | 98.6 /100 | #100 | Exceptional 3.29 |
| Immigrants | Burma/Myanmar | 98.6 /100 | #101 | Exceptional 3.29 |
| West Indians | 98.5 /100 | #102 | Exceptional 3.29 |
| Immigrants | Western Africa | 98.4 /100 | #103 | Exceptional 3.29 |