Pakistani vs U.S. Virgin Islander Single Male Poverty
COMPARE
Pakistani
U.S. Virgin Islander
Single Male Poverty
Single Male Poverty Comparison
Pakistanis
U.S. Virgin Islanders
12.4%
SINGLE MALE POVERTY
92.4/ 100
METRIC RATING
113th/ 347
METRIC RANK
14.5%
SINGLE MALE POVERTY
0.0/ 100
METRIC RATING
290th/ 347
METRIC RANK
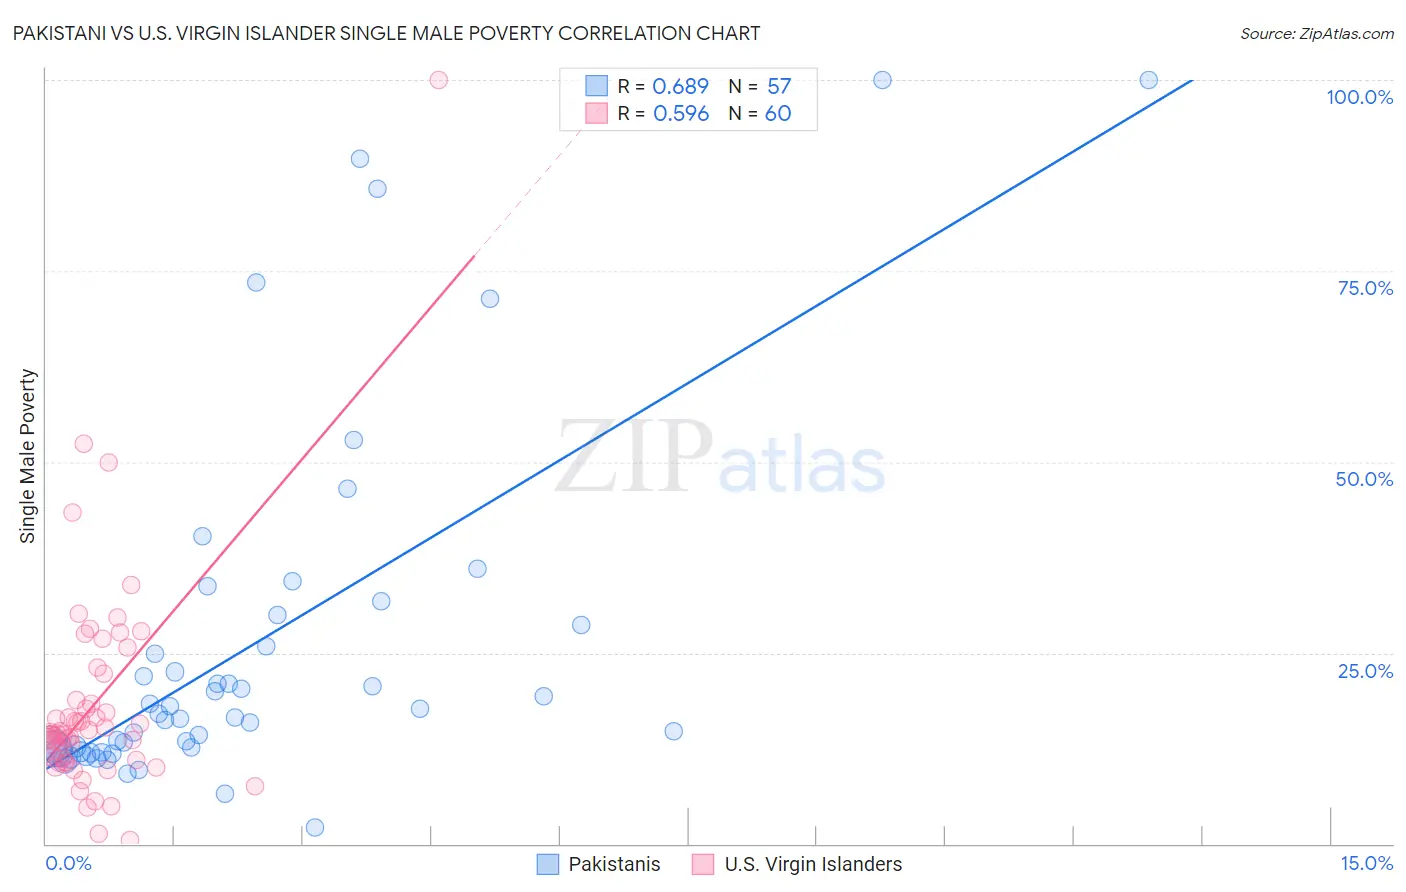
Pakistani vs U.S. Virgin Islander Single Male Poverty Correlation Chart
The statistical analysis conducted on geographies consisting of 304,084,454 people shows a significant positive correlation between the proportion of Pakistanis and poverty level among single males in the United States with a correlation coefficient (R) of 0.689 and weighted average of 12.4%. Similarly, the statistical analysis conducted on geographies consisting of 85,320,269 people shows a substantial positive correlation between the proportion of U.S. Virgin Islanders and poverty level among single males in the United States with a correlation coefficient (R) of 0.596 and weighted average of 14.5%, a difference of 17.4%.
Single Male Poverty Correlation Summary
| Measurement | Pakistani | U.S. Virgin Islander |
| Minimum | 2.1% | 0.45% |
| Maximum | 100.0% | 100.0% |
| Range | 97.9% | 99.5% |
| Mean | 26.1% | 18.4% |
| Median | 17.0% | 14.5% |
| Interquartile 25% (IQ1) | 12.3% | 10.8% |
| Interquartile 75% (IQ3) | 29.3% | 20.5% |
| Interquartile Range (IQR) | 17.0% | 9.7% |
| Standard Deviation (Sample) | 23.4% | 14.8% |
| Standard Deviation (Population) | 23.2% | 14.7% |
Similar Demographics by Single Male Poverty
Demographics Similar to Pakistanis by Single Male Poverty
In terms of single male poverty, the demographic groups most similar to Pakistanis are Nicaraguan (12.4%, a difference of 0.050%), Immigrants from Southern Europe (12.4%, a difference of 0.15%), Kenyan (12.4%, a difference of 0.19%), Immigrants from Syria (12.4%, a difference of 0.21%), and Immigrants from Oceania (12.4%, a difference of 0.22%).
| Demographics | Rating | Rank | Single Male Poverty |
| Immigrants | Morocco | 95.6 /100 | #106 | Exceptional 12.3% |
| Iraqis | 95.1 /100 | #107 | Exceptional 12.3% |
| Immigrants | Eastern Africa | 95.0 /100 | #108 | Exceptional 12.3% |
| Ugandans | 94.5 /100 | #109 | Exceptional 12.3% |
| Immigrants | Portugal | 93.6 /100 | #110 | Exceptional 12.3% |
| Immigrants | North Macedonia | 93.6 /100 | #111 | Exceptional 12.3% |
| Kenyans | 93.3 /100 | #112 | Exceptional 12.4% |
| Pakistanis | 92.4 /100 | #113 | Exceptional 12.4% |
| Nicaraguans | 92.1 /100 | #114 | Exceptional 12.4% |
| Immigrants | Southern Europe | 91.5 /100 | #115 | Exceptional 12.4% |
| Immigrants | Syria | 91.2 /100 | #116 | Exceptional 12.4% |
| Immigrants | Oceania | 91.1 /100 | #117 | Exceptional 12.4% |
| Albanians | 90.6 /100 | #118 | Exceptional 12.4% |
| Immigrants | Albania | 90.3 /100 | #119 | Exceptional 12.4% |
| Venezuelans | 89.4 /100 | #120 | Excellent 12.4% |
Demographics Similar to U.S. Virgin Islanders by Single Male Poverty
In terms of single male poverty, the demographic groups most similar to U.S. Virgin Islanders are Bahamian (14.6%, a difference of 0.15%), Immigrants from Dominica (14.5%, a difference of 0.23%), Nonimmigrants (14.6%, a difference of 0.28%), White/Caucasian (14.5%, a difference of 0.31%), and Iroquois (14.5%, a difference of 0.32%).
| Demographics | Rating | Rank | Single Male Poverty |
| Yaqui | 0.0 /100 | #283 | Tragic 14.2% |
| Immigrants | Bahamas | 0.0 /100 | #284 | Tragic 14.4% |
| French | 0.0 /100 | #285 | Tragic 14.4% |
| Celtics | 0.0 /100 | #286 | Tragic 14.5% |
| Iroquois | 0.0 /100 | #287 | Tragic 14.5% |
| Whites/Caucasians | 0.0 /100 | #288 | Tragic 14.5% |
| Immigrants | Dominica | 0.0 /100 | #289 | Tragic 14.5% |
| U.S. Virgin Islanders | 0.0 /100 | #290 | Tragic 14.5% |
| Bahamians | 0.0 /100 | #291 | Tragic 14.6% |
| Immigrants | Nonimmigrants | 0.0 /100 | #292 | Tragic 14.6% |
| French Canadians | 0.0 /100 | #293 | Tragic 14.6% |
| Ottawa | 0.0 /100 | #294 | Tragic 14.6% |
| Scotch-Irish | 0.0 /100 | #295 | Tragic 14.7% |
| Africans | 0.0 /100 | #296 | Tragic 14.7% |
| Immigrants | Dominican Republic | 0.0 /100 | #297 | Tragic 14.8% |