Scotch-Irish vs U.S. Virgin Islander Average Family Size
COMPARE
Scotch-Irish
U.S. Virgin Islander
Average Family Size
Average Family Size Comparison
Scotch-Irish
U.S. Virgin Islanders
3.11
AVERAGE FAMILY SIZE
0.0/ 100
METRIC RATING
331st/ 347
METRIC RANK
3.29
AVERAGE FAMILY SIZE
98.8/ 100
METRIC RATING
96th/ 347
METRIC RANK
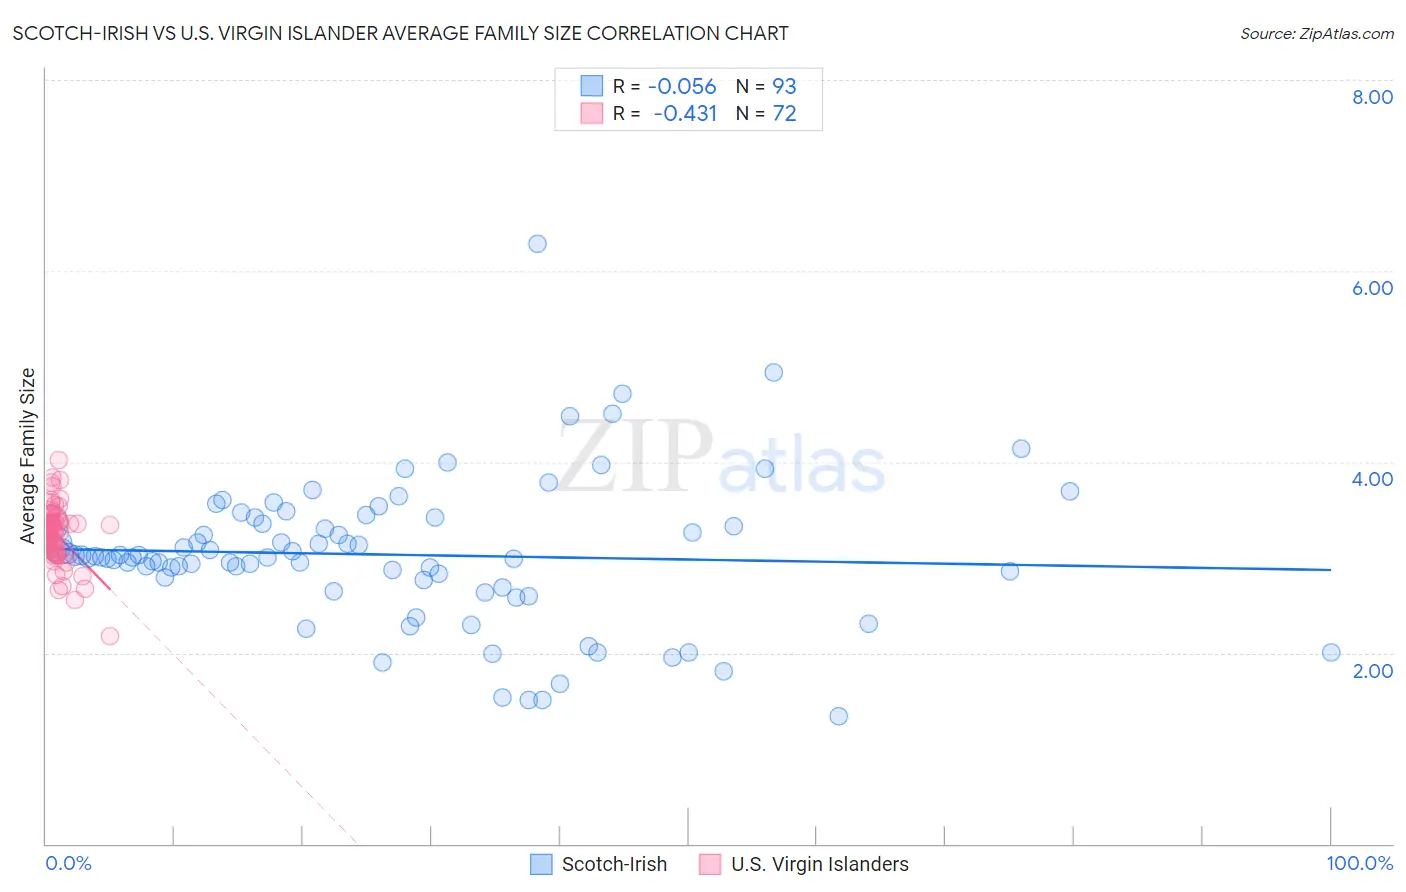
Scotch-Irish vs U.S. Virgin Islander Average Family Size Correlation Chart
The statistical analysis conducted on geographies consisting of 548,372,805 people shows a slight negative correlation between the proportion of Scotch-Irish and average family size in the United States with a correlation coefficient (R) of -0.056 and weighted average of 3.11. Similarly, the statistical analysis conducted on geographies consisting of 87,507,759 people shows a moderate negative correlation between the proportion of U.S. Virgin Islanders and average family size in the United States with a correlation coefficient (R) of -0.431 and weighted average of 3.29, a difference of 6.0%.
Average Family Size Correlation Summary
| Measurement | Scotch-Irish | U.S. Virgin Islander |
| Minimum | 1.34 | 2.17 |
| Maximum | 6.29 | 4.02 |
| Range | 4.95 | 1.85 |
| Mean | 3.03 | 3.24 |
| Median | 3.00 | 3.27 |
| Interquartile 25% (IQ1) | 2.73 | 3.08 |
| Interquartile 75% (IQ3) | 3.38 | 3.37 |
| Interquartile Range (IQR) | 0.65 | 0.29 |
| Standard Deviation (Sample) | 0.77 | 0.30 |
| Standard Deviation (Population) | 0.77 | 0.30 |
Similar Demographics by Average Family Size
Demographics Similar to Scotch-Irish by Average Family Size
In terms of average family size, the demographic groups most similar to Scotch-Irish are Latvian (3.11, a difference of 0.0%), Scottish (3.11, a difference of 0.0%), Estonian (3.10, a difference of 0.050%), Lithuanian (3.10, a difference of 0.050%), and Belgian (3.11, a difference of 0.060%).
| Demographics | Rating | Rank | Average Family Size |
| Celtics | 0.0 /100 | #324 | Tragic 3.11 |
| English | 0.0 /100 | #325 | Tragic 3.11 |
| Ottawa | 0.0 /100 | #326 | Tragic 3.11 |
| Dutch | 0.0 /100 | #327 | Tragic 3.11 |
| Czechs | 0.0 /100 | #328 | Tragic 3.11 |
| Belgians | 0.0 /100 | #329 | Tragic 3.11 |
| Latvians | 0.0 /100 | #330 | Tragic 3.11 |
| Scotch-Irish | 0.0 /100 | #331 | Tragic 3.11 |
| Scottish | 0.0 /100 | #332 | Tragic 3.11 |
| Estonians | 0.0 /100 | #333 | Tragic 3.10 |
| Lithuanians | 0.0 /100 | #334 | Tragic 3.10 |
| Luxembourgers | 0.0 /100 | #335 | Tragic 3.10 |
| Irish | 0.0 /100 | #336 | Tragic 3.10 |
| Swedes | 0.0 /100 | #337 | Tragic 3.10 |
| French | 0.0 /100 | #338 | Tragic 3.10 |
Demographics Similar to U.S. Virgin Islanders by Average Family Size
In terms of average family size, the demographic groups most similar to U.S. Virgin Islanders are Immigrants from Oceania (3.29, a difference of 0.040%), Barbadian (3.29, a difference of 0.040%), Nigerian (3.29, a difference of 0.050%), Guamanian/Chamorro (3.29, a difference of 0.050%), and Immigrants from Burma/Myanmar (3.29, a difference of 0.070%).
| Demographics | Rating | Rank | Average Family Size |
| Malaysians | 99.6 /100 | #89 | Exceptional 3.31 |
| Menominee | 99.4 /100 | #90 | Exceptional 3.30 |
| Immigrants | Pakistan | 99.2 /100 | #91 | Exceptional 3.30 |
| Immigrants | Cameroon | 99.2 /100 | #92 | Exceptional 3.30 |
| Peruvians | 99.2 /100 | #93 | Exceptional 3.30 |
| Sierra Leoneans | 99.0 /100 | #94 | Exceptional 3.30 |
| Immigrants | Lebanon | 99.0 /100 | #95 | Exceptional 3.30 |
| U.S. Virgin Islanders | 98.8 /100 | #96 | Exceptional 3.29 |
| Immigrants | Oceania | 98.7 /100 | #97 | Exceptional 3.29 |
| Barbadians | 98.6 /100 | #98 | Exceptional 3.29 |
| Nigerians | 98.6 /100 | #99 | Exceptional 3.29 |
| Guamanians/Chamorros | 98.6 /100 | #100 | Exceptional 3.29 |
| Immigrants | Burma/Myanmar | 98.6 /100 | #101 | Exceptional 3.29 |
| West Indians | 98.5 /100 | #102 | Exceptional 3.29 |
| Immigrants | Western Africa | 98.4 /100 | #103 | Exceptional 3.29 |