Pakistani vs Estonian Average Family Size
COMPARE
Pakistani
Estonian
Average Family Size
Average Family Size Comparison
Pakistanis
Estonians
3.22
AVERAGE FAMILY SIZE
33.7/ 100
METRIC RATING
189th/ 347
METRIC RANK
3.10
AVERAGE FAMILY SIZE
0.0/ 100
METRIC RATING
333rd/ 347
METRIC RANK
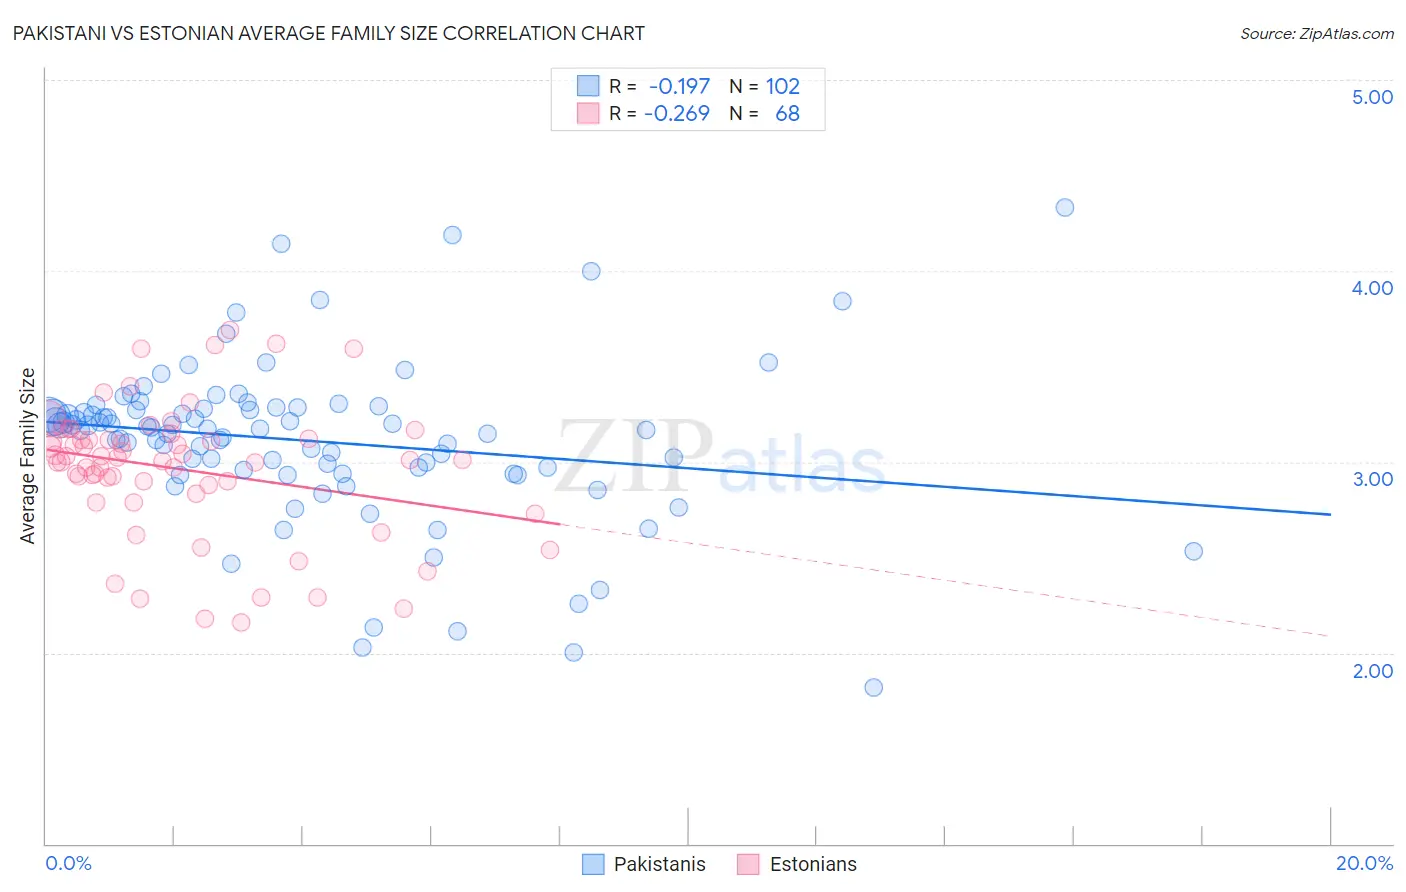
Pakistani vs Estonian Average Family Size Correlation Chart
The statistical analysis conducted on geographies consisting of 335,179,605 people shows a poor negative correlation between the proportion of Pakistanis and average family size in the United States with a correlation coefficient (R) of -0.197 and weighted average of 3.22. Similarly, the statistical analysis conducted on geographies consisting of 123,500,786 people shows a weak negative correlation between the proportion of Estonians and average family size in the United States with a correlation coefficient (R) of -0.269 and weighted average of 3.10, a difference of 3.7%.
Average Family Size Correlation Summary
| Measurement | Pakistani | Estonian |
| Minimum | 1.82 | 2.16 |
| Maximum | 4.33 | 3.69 |
| Range | 2.51 | 1.53 |
| Mean | 3.11 | 2.96 |
| Median | 3.17 | 3.01 |
| Interquartile 25% (IQ1) | 2.96 | 2.85 |
| Interquartile 75% (IQ3) | 3.28 | 3.12 |
| Interquartile Range (IQR) | 0.32 | 0.26 |
| Standard Deviation (Sample) | 0.42 | 0.35 |
| Standard Deviation (Population) | 0.42 | 0.34 |
Similar Demographics by Average Family Size
Demographics Similar to Pakistanis by Average Family Size
In terms of average family size, the demographic groups most similar to Pakistanis are Burmese (3.22, a difference of 0.060%), Immigrants from Zaire (3.22, a difference of 0.070%), Immigrants from Eastern Africa (3.22, a difference of 0.080%), Thai (3.22, a difference of 0.090%), and Immigrants from Israel (3.22, a difference of 0.090%).
| Demographics | Rating | Rank | Average Family Size |
| Moroccans | 44.2 /100 | #182 | Average 3.22 |
| Immigrants | Northern Africa | 41.7 /100 | #183 | Average 3.22 |
| Immigrants | Eastern Asia | 40.8 /100 | #184 | Average 3.22 |
| Immigrants | Sri Lanka | 39.8 /100 | #185 | Fair 3.22 |
| Immigrants | Argentina | 39.8 /100 | #186 | Fair 3.22 |
| Immigrants | Malaysia | 39.0 /100 | #187 | Fair 3.22 |
| Thais | 38.3 /100 | #188 | Fair 3.22 |
| Pakistanis | 33.7 /100 | #189 | Fair 3.22 |
| Burmese | 31.0 /100 | #190 | Fair 3.22 |
| Immigrants | Zaire | 30.5 /100 | #191 | Fair 3.22 |
| Immigrants | Eastern Africa | 30.1 /100 | #192 | Fair 3.22 |
| Immigrants | Israel | 29.3 /100 | #193 | Fair 3.22 |
| Immigrants | Sudan | 29.1 /100 | #194 | Fair 3.22 |
| Choctaw | 28.3 /100 | #195 | Fair 3.21 |
| Senegalese | 28.2 /100 | #196 | Fair 3.21 |
Demographics Similar to Estonians by Average Family Size
In terms of average family size, the demographic groups most similar to Estonians are Lithuanian (3.10, a difference of 0.0%), Luxembourger (3.10, a difference of 0.030%), Latvian (3.11, a difference of 0.050%), Scotch-Irish (3.11, a difference of 0.050%), and Scottish (3.11, a difference of 0.050%).
| Demographics | Rating | Rank | Average Family Size |
| Ottawa | 0.0 /100 | #326 | Tragic 3.11 |
| Dutch | 0.0 /100 | #327 | Tragic 3.11 |
| Czechs | 0.0 /100 | #328 | Tragic 3.11 |
| Belgians | 0.0 /100 | #329 | Tragic 3.11 |
| Latvians | 0.0 /100 | #330 | Tragic 3.11 |
| Scotch-Irish | 0.0 /100 | #331 | Tragic 3.11 |
| Scottish | 0.0 /100 | #332 | Tragic 3.11 |
| Estonians | 0.0 /100 | #333 | Tragic 3.10 |
| Lithuanians | 0.0 /100 | #334 | Tragic 3.10 |
| Luxembourgers | 0.0 /100 | #335 | Tragic 3.10 |
| Irish | 0.0 /100 | #336 | Tragic 3.10 |
| Swedes | 0.0 /100 | #337 | Tragic 3.10 |
| French | 0.0 /100 | #338 | Tragic 3.10 |
| Croatians | 0.0 /100 | #339 | Tragic 3.10 |
| Finns | 0.0 /100 | #340 | Tragic 3.09 |