Pakistani vs Cherokee Average Family Size
COMPARE
Pakistani
Cherokee
Average Family Size
Average Family Size Comparison
Pakistanis
Cherokee
3.22
AVERAGE FAMILY SIZE
33.7/ 100
METRIC RATING
189th/ 347
METRIC RANK
3.18
AVERAGE FAMILY SIZE
4.7/ 100
METRIC RATING
232nd/ 347
METRIC RANK
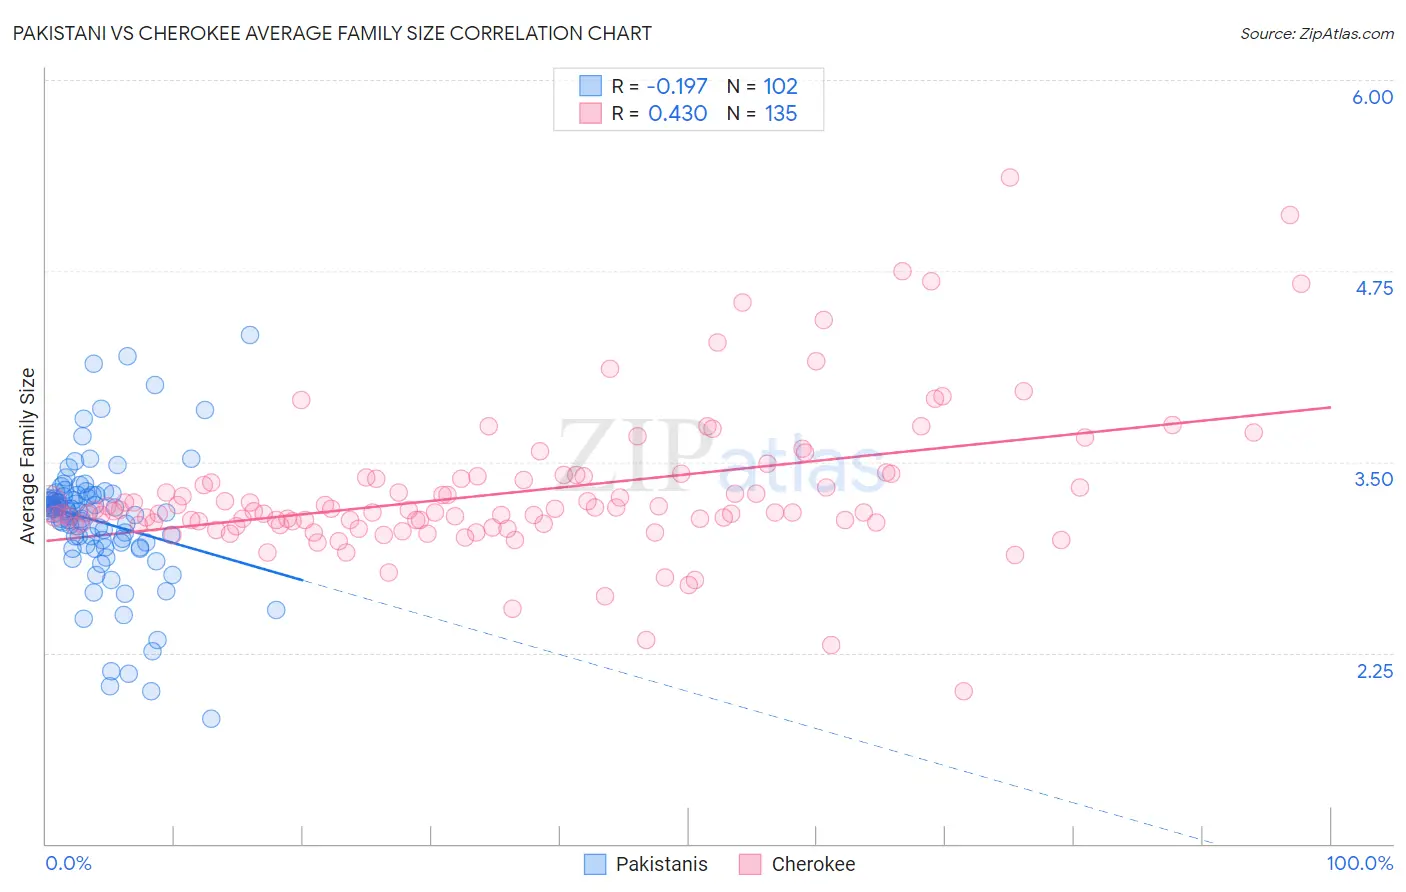
Pakistani vs Cherokee Average Family Size Correlation Chart
The statistical analysis conducted on geographies consisting of 335,179,605 people shows a poor negative correlation between the proportion of Pakistanis and average family size in the United States with a correlation coefficient (R) of -0.197 and weighted average of 3.22. Similarly, the statistical analysis conducted on geographies consisting of 493,383,050 people shows a moderate positive correlation between the proportion of Cherokee and average family size in the United States with a correlation coefficient (R) of 0.430 and weighted average of 3.18, a difference of 1.1%.
Average Family Size Correlation Summary
| Measurement | Pakistani | Cherokee |
| Minimum | 1.82 | 2.00 |
| Maximum | 4.33 | 5.36 |
| Range | 2.51 | 3.36 |
| Mean | 3.11 | 3.30 |
| Median | 3.17 | 3.18 |
| Interquartile 25% (IQ1) | 2.96 | 3.09 |
| Interquartile 75% (IQ3) | 3.28 | 3.40 |
| Interquartile Range (IQR) | 0.32 | 0.30 |
| Standard Deviation (Sample) | 0.42 | 0.48 |
| Standard Deviation (Population) | 0.42 | 0.48 |
Similar Demographics by Average Family Size
Demographics Similar to Pakistanis by Average Family Size
In terms of average family size, the demographic groups most similar to Pakistanis are Burmese (3.22, a difference of 0.060%), Immigrants from Zaire (3.22, a difference of 0.070%), Immigrants from Eastern Africa (3.22, a difference of 0.080%), Thai (3.22, a difference of 0.090%), and Immigrants from Israel (3.22, a difference of 0.090%).
| Demographics | Rating | Rank | Average Family Size |
| Moroccans | 44.2 /100 | #182 | Average 3.22 |
| Immigrants | Northern Africa | 41.7 /100 | #183 | Average 3.22 |
| Immigrants | Eastern Asia | 40.8 /100 | #184 | Average 3.22 |
| Immigrants | Sri Lanka | 39.8 /100 | #185 | Fair 3.22 |
| Immigrants | Argentina | 39.8 /100 | #186 | Fair 3.22 |
| Immigrants | Malaysia | 39.0 /100 | #187 | Fair 3.22 |
| Thais | 38.3 /100 | #188 | Fair 3.22 |
| Pakistanis | 33.7 /100 | #189 | Fair 3.22 |
| Burmese | 31.0 /100 | #190 | Fair 3.22 |
| Immigrants | Zaire | 30.5 /100 | #191 | Fair 3.22 |
| Immigrants | Eastern Africa | 30.1 /100 | #192 | Fair 3.22 |
| Immigrants | Israel | 29.3 /100 | #193 | Fair 3.22 |
| Immigrants | Sudan | 29.1 /100 | #194 | Fair 3.22 |
| Choctaw | 28.3 /100 | #195 | Fair 3.21 |
| Senegalese | 28.2 /100 | #196 | Fair 3.21 |
Demographics Similar to Cherokee by Average Family Size
In terms of average family size, the demographic groups most similar to Cherokee are Brazilian (3.18, a difference of 0.020%), Iranian (3.18, a difference of 0.030%), Icelander (3.19, a difference of 0.040%), Basque (3.19, a difference of 0.040%), and Immigrants from Turkey (3.18, a difference of 0.050%).
| Demographics | Rating | Rank | Average Family Size |
| Cree | 6.2 /100 | #225 | Tragic 3.19 |
| Chickasaw | 6.0 /100 | #226 | Tragic 3.19 |
| Portuguese | 6.0 /100 | #227 | Tragic 3.19 |
| Immigrants | Nonimmigrants | 5.7 /100 | #228 | Tragic 3.19 |
| Immigrants | Italy | 5.3 /100 | #229 | Tragic 3.19 |
| Icelanders | 5.2 /100 | #230 | Tragic 3.19 |
| Basques | 5.2 /100 | #231 | Tragic 3.19 |
| Cherokee | 4.7 /100 | #232 | Tragic 3.18 |
| Brazilians | 4.5 /100 | #233 | Tragic 3.18 |
| Iranians | 4.5 /100 | #234 | Tragic 3.18 |
| Immigrants | Turkey | 4.2 /100 | #235 | Tragic 3.18 |
| Immigrants | Portugal | 4.2 /100 | #236 | Tragic 3.18 |
| Immigrants | Romania | 3.7 /100 | #237 | Tragic 3.18 |
| Romanians | 3.7 /100 | #238 | Tragic 3.18 |
| Houma | 3.4 /100 | #239 | Tragic 3.18 |