Pakistani vs Immigrants from Iran Average Family Size
COMPARE
Pakistani
Immigrants from Iran
Average Family Size
Average Family Size Comparison
Pakistanis
Immigrants from Iran
3.22
AVERAGE FAMILY SIZE
33.7/ 100
METRIC RATING
189th/ 347
METRIC RANK
3.20
AVERAGE FAMILY SIZE
12.1/ 100
METRIC RATING
211th/ 347
METRIC RANK
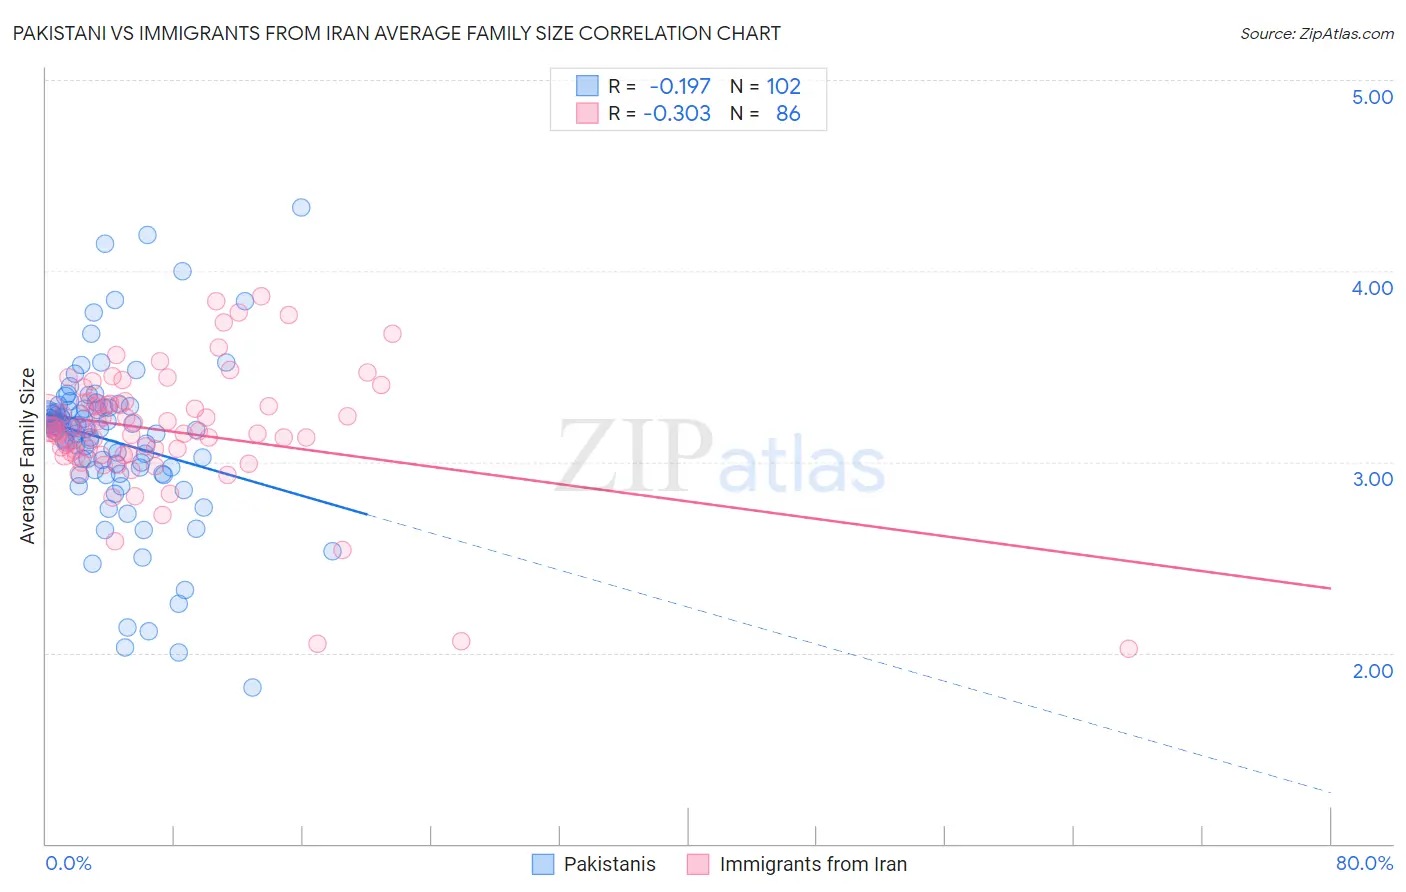
Pakistani vs Immigrants from Iran Average Family Size Correlation Chart
The statistical analysis conducted on geographies consisting of 335,179,605 people shows a poor negative correlation between the proportion of Pakistanis and average family size in the United States with a correlation coefficient (R) of -0.197 and weighted average of 3.22. Similarly, the statistical analysis conducted on geographies consisting of 279,830,460 people shows a mild negative correlation between the proportion of Immigrants from Iran and average family size in the United States with a correlation coefficient (R) of -0.303 and weighted average of 3.20, a difference of 0.60%.
Average Family Size Correlation Summary
| Measurement | Pakistani | Immigrants from Iran |
| Minimum | 1.82 | 2.02 |
| Maximum | 4.33 | 3.87 |
| Range | 2.51 | 1.85 |
| Mean | 3.11 | 3.16 |
| Median | 3.17 | 3.16 |
| Interquartile 25% (IQ1) | 2.96 | 3.04 |
| Interquartile 75% (IQ3) | 3.28 | 3.31 |
| Interquartile Range (IQR) | 0.32 | 0.26 |
| Standard Deviation (Sample) | 0.42 | 0.33 |
| Standard Deviation (Population) | 0.42 | 0.33 |
Similar Demographics by Average Family Size
Demographics Similar to Pakistanis by Average Family Size
In terms of average family size, the demographic groups most similar to Pakistanis are Burmese (3.22, a difference of 0.060%), Immigrants from Zaire (3.22, a difference of 0.070%), Immigrants from Eastern Africa (3.22, a difference of 0.080%), Thai (3.22, a difference of 0.090%), and Immigrants from Israel (3.22, a difference of 0.090%).
| Demographics | Rating | Rank | Average Family Size |
| Moroccans | 44.2 /100 | #182 | Average 3.22 |
| Immigrants | Northern Africa | 41.7 /100 | #183 | Average 3.22 |
| Immigrants | Eastern Asia | 40.8 /100 | #184 | Average 3.22 |
| Immigrants | Sri Lanka | 39.8 /100 | #185 | Fair 3.22 |
| Immigrants | Argentina | 39.8 /100 | #186 | Fair 3.22 |
| Immigrants | Malaysia | 39.0 /100 | #187 | Fair 3.22 |
| Thais | 38.3 /100 | #188 | Fair 3.22 |
| Pakistanis | 33.7 /100 | #189 | Fair 3.22 |
| Burmese | 31.0 /100 | #190 | Fair 3.22 |
| Immigrants | Zaire | 30.5 /100 | #191 | Fair 3.22 |
| Immigrants | Eastern Africa | 30.1 /100 | #192 | Fair 3.22 |
| Immigrants | Israel | 29.3 /100 | #193 | Fair 3.22 |
| Immigrants | Sudan | 29.1 /100 | #194 | Fair 3.22 |
| Choctaw | 28.3 /100 | #195 | Fair 3.21 |
| Senegalese | 28.2 /100 | #196 | Fair 3.21 |
Demographics Similar to Immigrants from Iran by Average Family Size
In terms of average family size, the demographic groups most similar to Immigrants from Iran are Creek (3.20, a difference of 0.0%), Zimbabwean (3.20, a difference of 0.020%), Mongolian (3.20, a difference of 0.020%), Somali (3.20, a difference of 0.040%), and Chippewa (3.20, a difference of 0.050%).
| Demographics | Rating | Rank | Average Family Size |
| Immigrants | Poland | 16.6 /100 | #204 | Poor 3.20 |
| Paraguayans | 16.3 /100 | #205 | Poor 3.20 |
| Immigrants | Cabo Verde | 16.0 /100 | #206 | Poor 3.20 |
| Filipinos | 13.6 /100 | #207 | Poor 3.20 |
| Chippewa | 13.3 /100 | #208 | Poor 3.20 |
| Sudanese | 13.3 /100 | #209 | Poor 3.20 |
| Zimbabweans | 12.6 /100 | #210 | Poor 3.20 |
| Immigrants | Iran | 12.1 /100 | #211 | Poor 3.20 |
| Creek | 12.1 /100 | #212 | Poor 3.20 |
| Mongolians | 11.5 /100 | #213 | Poor 3.20 |
| Somalis | 11.2 /100 | #214 | Poor 3.20 |
| Delaware | 11.1 /100 | #215 | Poor 3.20 |
| Bermudans | 11.0 /100 | #216 | Poor 3.20 |
| Immigrants | Somalia | 10.3 /100 | #217 | Poor 3.20 |
| French American Indians | 9.8 /100 | #218 | Tragic 3.20 |