Pakistani vs Bulgarian Average Family Size
COMPARE
Pakistani
Bulgarian
Average Family Size
Average Family Size Comparison
Pakistanis
Bulgarians
3.22
AVERAGE FAMILY SIZE
33.7/ 100
METRIC RATING
189th/ 347
METRIC RANK
3.13
AVERAGE FAMILY SIZE
0.1/ 100
METRIC RATING
313th/ 347
METRIC RANK
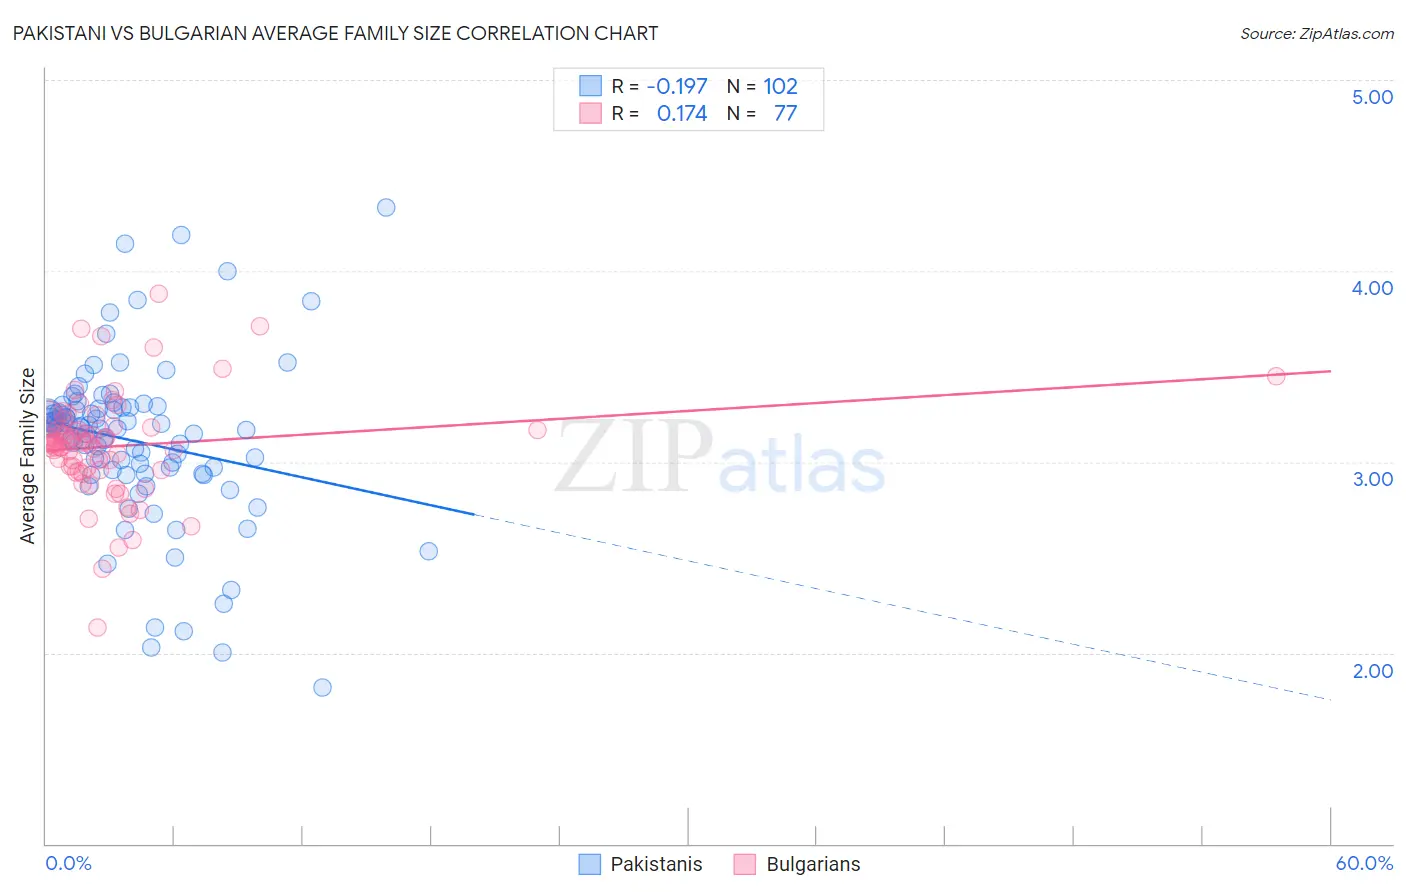
Pakistani vs Bulgarian Average Family Size Correlation Chart
The statistical analysis conducted on geographies consisting of 335,179,605 people shows a poor negative correlation between the proportion of Pakistanis and average family size in the United States with a correlation coefficient (R) of -0.197 and weighted average of 3.22. Similarly, the statistical analysis conducted on geographies consisting of 205,566,985 people shows a poor positive correlation between the proportion of Bulgarians and average family size in the United States with a correlation coefficient (R) of 0.174 and weighted average of 3.13, a difference of 3.0%.
Average Family Size Correlation Summary
| Measurement | Pakistani | Bulgarian |
| Minimum | 1.82 | 2.13 |
| Maximum | 4.33 | 3.88 |
| Range | 2.51 | 1.75 |
| Mean | 3.11 | 3.08 |
| Median | 3.17 | 3.09 |
| Interquartile 25% (IQ1) | 2.96 | 2.96 |
| Interquartile 75% (IQ3) | 3.28 | 3.17 |
| Interquartile Range (IQR) | 0.32 | 0.21 |
| Standard Deviation (Sample) | 0.42 | 0.28 |
| Standard Deviation (Population) | 0.42 | 0.27 |
Similar Demographics by Average Family Size
Demographics Similar to Pakistanis by Average Family Size
In terms of average family size, the demographic groups most similar to Pakistanis are Burmese (3.22, a difference of 0.060%), Immigrants from Zaire (3.22, a difference of 0.070%), Immigrants from Eastern Africa (3.22, a difference of 0.080%), Thai (3.22, a difference of 0.090%), and Immigrants from Israel (3.22, a difference of 0.090%).
| Demographics | Rating | Rank | Average Family Size |
| Moroccans | 44.2 /100 | #182 | Average 3.22 |
| Immigrants | Northern Africa | 41.7 /100 | #183 | Average 3.22 |
| Immigrants | Eastern Asia | 40.8 /100 | #184 | Average 3.22 |
| Immigrants | Sri Lanka | 39.8 /100 | #185 | Fair 3.22 |
| Immigrants | Argentina | 39.8 /100 | #186 | Fair 3.22 |
| Immigrants | Malaysia | 39.0 /100 | #187 | Fair 3.22 |
| Thais | 38.3 /100 | #188 | Fair 3.22 |
| Pakistanis | 33.7 /100 | #189 | Fair 3.22 |
| Burmese | 31.0 /100 | #190 | Fair 3.22 |
| Immigrants | Zaire | 30.5 /100 | #191 | Fair 3.22 |
| Immigrants | Eastern Africa | 30.1 /100 | #192 | Fair 3.22 |
| Immigrants | Israel | 29.3 /100 | #193 | Fair 3.22 |
| Immigrants | Sudan | 29.1 /100 | #194 | Fair 3.22 |
| Choctaw | 28.3 /100 | #195 | Fair 3.21 |
| Senegalese | 28.2 /100 | #196 | Fair 3.21 |
Demographics Similar to Bulgarians by Average Family Size
In terms of average family size, the demographic groups most similar to Bulgarians are Immigrants from Australia (3.13, a difference of 0.0%), Immigrants from Northern Europe (3.13, a difference of 0.030%), Russian (3.12, a difference of 0.040%), Immigrants from Scotland (3.12, a difference of 0.060%), and Czechoslovakian (3.13, a difference of 0.070%).
| Demographics | Rating | Rank | Average Family Size |
| Immigrants | Ireland | 0.1 /100 | #306 | Tragic 3.13 |
| Immigrants | Serbia | 0.1 /100 | #307 | Tragic 3.13 |
| Slavs | 0.1 /100 | #308 | Tragic 3.13 |
| Northern Europeans | 0.1 /100 | #309 | Tragic 3.13 |
| Czechoslovakians | 0.1 /100 | #310 | Tragic 3.13 |
| Immigrants | Northern Europe | 0.1 /100 | #311 | Tragic 3.13 |
| Immigrants | Australia | 0.1 /100 | #312 | Tragic 3.13 |
| Bulgarians | 0.1 /100 | #313 | Tragic 3.13 |
| Russians | 0.1 /100 | #314 | Tragic 3.12 |
| Immigrants | Scotland | 0.1 /100 | #315 | Tragic 3.12 |
| Serbians | 0.1 /100 | #316 | Tragic 3.12 |
| Italians | 0.1 /100 | #317 | Tragic 3.12 |
| Eastern Europeans | 0.1 /100 | #318 | Tragic 3.12 |
| Welsh | 0.1 /100 | #319 | Tragic 3.12 |
| Immigrants | North America | 0.0 /100 | #320 | Tragic 3.12 |