Pakistani vs Immigrants from Norway Average Family Size
COMPARE
Pakistani
Immigrants from Norway
Average Family Size
Average Family Size Comparison
Pakistanis
Immigrants from Norway
3.22
AVERAGE FAMILY SIZE
33.7/ 100
METRIC RATING
189th/ 347
METRIC RANK
3.14
AVERAGE FAMILY SIZE
0.3/ 100
METRIC RATING
289th/ 347
METRIC RANK
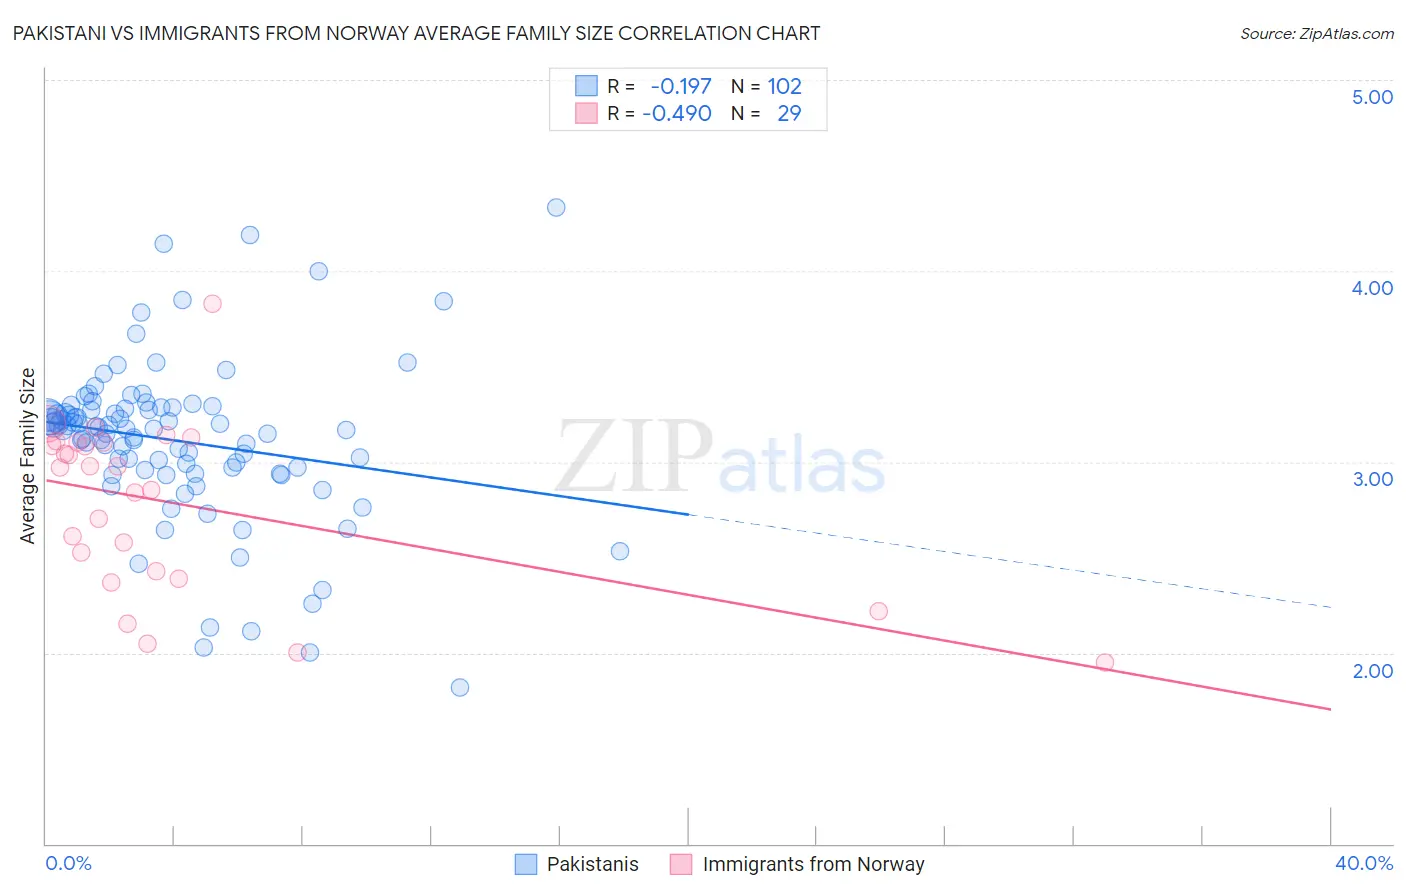
Pakistani vs Immigrants from Norway Average Family Size Correlation Chart
The statistical analysis conducted on geographies consisting of 335,179,605 people shows a poor negative correlation between the proportion of Pakistanis and average family size in the United States with a correlation coefficient (R) of -0.197 and weighted average of 3.22. Similarly, the statistical analysis conducted on geographies consisting of 116,686,104 people shows a moderate negative correlation between the proportion of Immigrants from Norway and average family size in the United States with a correlation coefficient (R) of -0.490 and weighted average of 3.14, a difference of 2.4%.
Average Family Size Correlation Summary
| Measurement | Pakistani | Immigrants from Norway |
| Minimum | 1.82 | 1.95 |
| Maximum | 4.33 | 3.83 |
| Range | 2.51 | 1.88 |
| Mean | 3.11 | 2.78 |
| Median | 3.17 | 2.97 |
| Interquartile 25% (IQ1) | 2.96 | 2.41 |
| Interquartile 75% (IQ3) | 3.28 | 3.10 |
| Interquartile Range (IQR) | 0.32 | 0.69 |
| Standard Deviation (Sample) | 0.42 | 0.45 |
| Standard Deviation (Population) | 0.42 | 0.44 |
Similar Demographics by Average Family Size
Demographics Similar to Pakistanis by Average Family Size
In terms of average family size, the demographic groups most similar to Pakistanis are Burmese (3.22, a difference of 0.060%), Immigrants from Zaire (3.22, a difference of 0.070%), Immigrants from Eastern Africa (3.22, a difference of 0.080%), Thai (3.22, a difference of 0.090%), and Immigrants from Israel (3.22, a difference of 0.090%).
| Demographics | Rating | Rank | Average Family Size |
| Moroccans | 44.2 /100 | #182 | Average 3.22 |
| Immigrants | Northern Africa | 41.7 /100 | #183 | Average 3.22 |
| Immigrants | Eastern Asia | 40.8 /100 | #184 | Average 3.22 |
| Immigrants | Sri Lanka | 39.8 /100 | #185 | Fair 3.22 |
| Immigrants | Argentina | 39.8 /100 | #186 | Fair 3.22 |
| Immigrants | Malaysia | 39.0 /100 | #187 | Fair 3.22 |
| Thais | 38.3 /100 | #188 | Fair 3.22 |
| Pakistanis | 33.7 /100 | #189 | Fair 3.22 |
| Burmese | 31.0 /100 | #190 | Fair 3.22 |
| Immigrants | Zaire | 30.5 /100 | #191 | Fair 3.22 |
| Immigrants | Eastern Africa | 30.1 /100 | #192 | Fair 3.22 |
| Immigrants | Israel | 29.3 /100 | #193 | Fair 3.22 |
| Immigrants | Sudan | 29.1 /100 | #194 | Fair 3.22 |
| Choctaw | 28.3 /100 | #195 | Fair 3.21 |
| Senegalese | 28.2 /100 | #196 | Fair 3.21 |
Demographics Similar to Immigrants from Norway by Average Family Size
In terms of average family size, the demographic groups most similar to Immigrants from Norway are Greek (3.14, a difference of 0.0%), Immigrants from Czechoslovakia (3.14, a difference of 0.0%), Immigrants from Netherlands (3.14, a difference of 0.010%), Cypriot (3.14, a difference of 0.030%), and White/Caucasian (3.14, a difference of 0.060%).
| Demographics | Rating | Rank | Average Family Size |
| Yugoslavians | 0.4 /100 | #282 | Tragic 3.15 |
| German Russians | 0.4 /100 | #283 | Tragic 3.15 |
| Immigrants | France | 0.4 /100 | #284 | Tragic 3.15 |
| Whites/Caucasians | 0.3 /100 | #285 | Tragic 3.14 |
| Immigrants | Netherlands | 0.3 /100 | #286 | Tragic 3.14 |
| Greeks | 0.3 /100 | #287 | Tragic 3.14 |
| Immigrants | Czechoslovakia | 0.3 /100 | #288 | Tragic 3.14 |
| Immigrants | Norway | 0.3 /100 | #289 | Tragic 3.14 |
| Cypriots | 0.3 /100 | #290 | Tragic 3.14 |
| Alsatians | 0.2 /100 | #291 | Tragic 3.14 |
| Europeans | 0.2 /100 | #292 | Tragic 3.14 |
| Scandinavians | 0.2 /100 | #293 | Tragic 3.14 |
| Immigrants | Croatia | 0.2 /100 | #294 | Tragic 3.14 |
| Austrians | 0.2 /100 | #295 | Tragic 3.14 |
| Ukrainians | 0.2 /100 | #296 | Tragic 3.14 |