Pakistani vs Immigrants from Cuba Average Family Size
COMPARE
Pakistani
Immigrants from Cuba
Average Family Size
Average Family Size Comparison
Pakistanis
Immigrants from Cuba
3.22
AVERAGE FAMILY SIZE
33.7/ 100
METRIC RATING
189th/ 347
METRIC RANK
3.26
AVERAGE FAMILY SIZE
91.3/ 100
METRIC RATING
125th/ 347
METRIC RANK
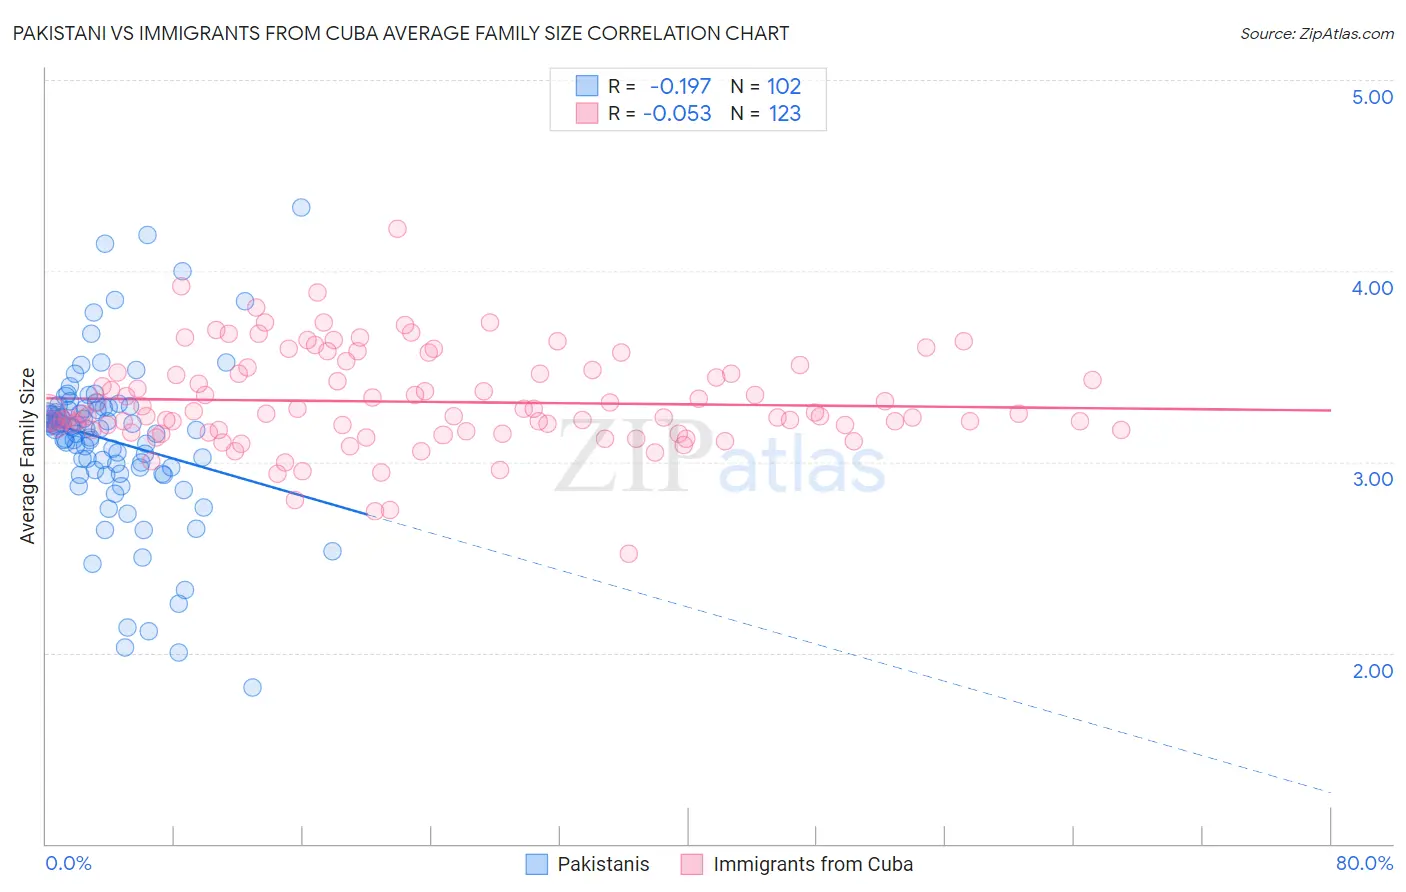
Pakistani vs Immigrants from Cuba Average Family Size Correlation Chart
The statistical analysis conducted on geographies consisting of 335,179,605 people shows a poor negative correlation between the proportion of Pakistanis and average family size in the United States with a correlation coefficient (R) of -0.197 and weighted average of 3.22. Similarly, the statistical analysis conducted on geographies consisting of 325,939,675 people shows a slight negative correlation between the proportion of Immigrants from Cuba and average family size in the United States with a correlation coefficient (R) of -0.053 and weighted average of 3.26, a difference of 1.4%.
Average Family Size Correlation Summary
| Measurement | Pakistani | Immigrants from Cuba |
| Minimum | 1.82 | 2.52 |
| Maximum | 4.33 | 4.22 |
| Range | 2.51 | 1.70 |
| Mean | 3.11 | 3.31 |
| Median | 3.17 | 3.25 |
| Interquartile 25% (IQ1) | 2.96 | 3.16 |
| Interquartile 75% (IQ3) | 3.28 | 3.47 |
| Interquartile Range (IQR) | 0.32 | 0.31 |
| Standard Deviation (Sample) | 0.42 | 0.26 |
| Standard Deviation (Population) | 0.42 | 0.26 |
Similar Demographics by Average Family Size
Demographics Similar to Pakistanis by Average Family Size
In terms of average family size, the demographic groups most similar to Pakistanis are Burmese (3.22, a difference of 0.060%), Immigrants from Zaire (3.22, a difference of 0.070%), Immigrants from Eastern Africa (3.22, a difference of 0.080%), Thai (3.22, a difference of 0.090%), and Immigrants from Israel (3.22, a difference of 0.090%).
| Demographics | Rating | Rank | Average Family Size |
| Moroccans | 44.2 /100 | #182 | Average 3.22 |
| Immigrants | Northern Africa | 41.7 /100 | #183 | Average 3.22 |
| Immigrants | Eastern Asia | 40.8 /100 | #184 | Average 3.22 |
| Immigrants | Sri Lanka | 39.8 /100 | #185 | Fair 3.22 |
| Immigrants | Argentina | 39.8 /100 | #186 | Fair 3.22 |
| Immigrants | Malaysia | 39.0 /100 | #187 | Fair 3.22 |
| Thais | 38.3 /100 | #188 | Fair 3.22 |
| Pakistanis | 33.7 /100 | #189 | Fair 3.22 |
| Burmese | 31.0 /100 | #190 | Fair 3.22 |
| Immigrants | Zaire | 30.5 /100 | #191 | Fair 3.22 |
| Immigrants | Eastern Africa | 30.1 /100 | #192 | Fair 3.22 |
| Immigrants | Israel | 29.3 /100 | #193 | Fair 3.22 |
| Immigrants | Sudan | 29.1 /100 | #194 | Fair 3.22 |
| Choctaw | 28.3 /100 | #195 | Fair 3.21 |
| Senegalese | 28.2 /100 | #196 | Fair 3.21 |
Demographics Similar to Immigrants from Cuba by Average Family Size
In terms of average family size, the demographic groups most similar to Immigrants from Cuba are South American Indian (3.26, a difference of 0.020%), Immigrants from Costa Rica (3.26, a difference of 0.030%), Immigrants from Syria (3.26, a difference of 0.040%), Alaskan Athabascan (3.27, a difference of 0.070%), and Colombian (3.26, a difference of 0.080%).
| Demographics | Rating | Rank | Average Family Size |
| Immigrants | Asia | 94.0 /100 | #118 | Exceptional 3.27 |
| Immigrants | Indonesia | 93.7 /100 | #119 | Exceptional 3.27 |
| Immigrants | Bahamas | 93.6 /100 | #120 | Exceptional 3.27 |
| Immigrants | Thailand | 93.3 /100 | #121 | Exceptional 3.27 |
| Immigrants | Colombia | 92.8 /100 | #122 | Exceptional 3.27 |
| Alaskan Athabascans | 92.4 /100 | #123 | Exceptional 3.27 |
| South American Indians | 91.6 /100 | #124 | Exceptional 3.26 |
| Immigrants | Cuba | 91.3 /100 | #125 | Exceptional 3.26 |
| Immigrants | Costa Rica | 90.7 /100 | #126 | Exceptional 3.26 |
| Immigrants | Syria | 90.6 /100 | #127 | Exceptional 3.26 |
| Colombians | 89.9 /100 | #128 | Excellent 3.26 |
| Immigrants | Hong Kong | 88.6 /100 | #129 | Excellent 3.26 |
| Laotians | 88.5 /100 | #130 | Excellent 3.26 |
| Immigrants | Western Asia | 87.7 /100 | #131 | Excellent 3.26 |
| Costa Ricans | 86.8 /100 | #132 | Excellent 3.26 |