Pakistani vs U.S. Virgin Islander Seniors Poverty Over the Age of 65
COMPARE
Pakistani
U.S. Virgin Islander
Seniors Poverty Over the Age of 65
Seniors Poverty Over the Age of 65 Comparison
Pakistanis
U.S. Virgin Islanders
10.3%
SENIORS POVERTY OVER THE AGE OF 65
92.2/ 100
METRIC RATING
116th/ 347
METRIC RANK
14.0%
SENIORS POVERTY OVER THE AGE OF 65
0.0/ 100
METRIC RATING
301st/ 347
METRIC RANK
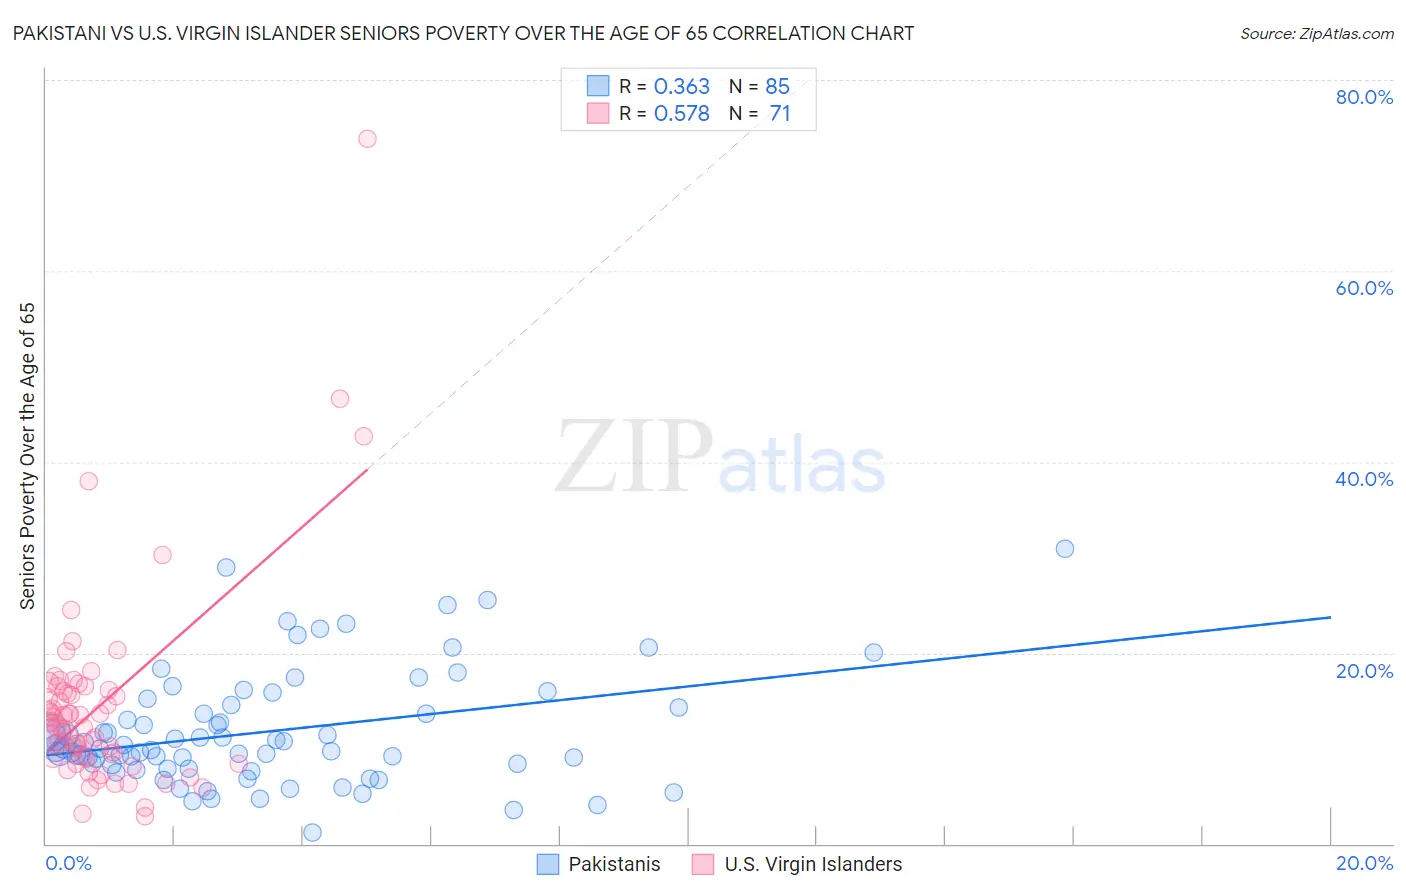
Pakistani vs U.S. Virgin Islander Seniors Poverty Over the Age of 65 Correlation Chart
The statistical analysis conducted on geographies consisting of 334,315,212 people shows a mild positive correlation between the proportion of Pakistanis and poverty level among seniors over the age of 65 in the United States with a correlation coefficient (R) of 0.363 and weighted average of 10.3%. Similarly, the statistical analysis conducted on geographies consisting of 87,442,281 people shows a substantial positive correlation between the proportion of U.S. Virgin Islanders and poverty level among seniors over the age of 65 in the United States with a correlation coefficient (R) of 0.578 and weighted average of 14.0%, a difference of 35.9%.
Seniors Poverty Over the Age of 65 Correlation Summary
| Measurement | Pakistani | U.S. Virgin Islander |
| Minimum | 1.2% | 2.9% |
| Maximum | 30.9% | 73.8% |
| Range | 29.7% | 70.9% |
| Mean | 11.8% | 14.5% |
| Median | 10.0% | 12.7% |
| Interquartile 25% (IQ1) | 8.0% | 8.9% |
| Interquartile 75% (IQ3) | 14.4% | 16.1% |
| Interquartile Range (IQR) | 6.4% | 7.2% |
| Standard Deviation (Sample) | 5.9% | 10.6% |
| Standard Deviation (Population) | 5.9% | 10.5% |
Similar Demographics by Seniors Poverty Over the Age of 65
Demographics Similar to Pakistanis by Seniors Poverty Over the Age of 65
In terms of seniors poverty over the age of 65, the demographic groups most similar to Pakistanis are Lebanese (10.3%, a difference of 0.060%), Okinawan (10.4%, a difference of 0.14%), Immigrants from Italy (10.3%, a difference of 0.15%), Immigrants from Denmark (10.3%, a difference of 0.19%), and Immigrants from Western Europe (10.4%, a difference of 0.33%).
| Demographics | Rating | Rank | Seniors Poverty Over the Age of 65 |
| Syrians | 93.8 /100 | #109 | Exceptional 10.3% |
| Immigrants | Zimbabwe | 93.5 /100 | #110 | Exceptional 10.3% |
| Immigrants | Belgium | 93.4 /100 | #111 | Exceptional 10.3% |
| Immigrants | Korea | 93.3 /100 | #112 | Exceptional 10.3% |
| Immigrants | Romania | 93.3 /100 | #113 | Exceptional 10.3% |
| Immigrants | Denmark | 92.7 /100 | #114 | Exceptional 10.3% |
| Immigrants | Italy | 92.6 /100 | #115 | Exceptional 10.3% |
| Pakistanis | 92.2 /100 | #116 | Exceptional 10.3% |
| Lebanese | 92.0 /100 | #117 | Exceptional 10.3% |
| Okinawans | 91.7 /100 | #118 | Exceptional 10.4% |
| Immigrants | Western Europe | 91.1 /100 | #119 | Exceptional 10.4% |
| Immigrants | Bosnia and Herzegovina | 90.8 /100 | #120 | Exceptional 10.4% |
| Immigrants | Iraq | 90.7 /100 | #121 | Exceptional 10.4% |
| Immigrants | Moldova | 90.7 /100 | #122 | Exceptional 10.4% |
| Hmong | 90.0 /100 | #123 | Exceptional 10.4% |
Demographics Similar to U.S. Virgin Islanders by Seniors Poverty Over the Age of 65
In terms of seniors poverty over the age of 65, the demographic groups most similar to U.S. Virgin Islanders are Yup'ik (14.1%, a difference of 0.080%), Immigrants from Bangladesh (14.1%, a difference of 0.19%), Immigrants from Uzbekistan (14.0%, a difference of 0.21%), Ecuadorian (14.0%, a difference of 0.28%), and Immigrants from Belize (14.0%, a difference of 0.36%).
| Demographics | Rating | Rank | Seniors Poverty Over the Age of 65 |
| Cheyenne | 0.0 /100 | #294 | Tragic 13.9% |
| Apache | 0.0 /100 | #295 | Tragic 13.9% |
| Immigrants | Jamaica | 0.0 /100 | #296 | Tragic 13.9% |
| Vietnamese | 0.0 /100 | #297 | Tragic 14.0% |
| Immigrants | Belize | 0.0 /100 | #298 | Tragic 14.0% |
| Ecuadorians | 0.0 /100 | #299 | Tragic 14.0% |
| Immigrants | Uzbekistan | 0.0 /100 | #300 | Tragic 14.0% |
| U.S. Virgin Islanders | 0.0 /100 | #301 | Tragic 14.0% |
| Yup'ik | 0.0 /100 | #302 | Tragic 14.1% |
| Immigrants | Bangladesh | 0.0 /100 | #303 | Tragic 14.1% |
| West Indians | 0.0 /100 | #304 | Tragic 14.1% |
| Immigrants | Trinidad and Tobago | 0.0 /100 | #305 | Tragic 14.1% |
| Immigrants | Latin America | 0.0 /100 | #306 | Tragic 14.2% |
| Immigrants | West Indies | 0.0 /100 | #307 | Tragic 14.2% |
| Trinidadians and Tobagonians | 0.0 /100 | #308 | Tragic 14.2% |