Pakistani vs U.S. Virgin Islander Median Female Earnings
COMPARE
Pakistani
U.S. Virgin Islander
Median Female Earnings
Median Female Earnings Comparison
Pakistanis
U.S. Virgin Islanders
$40,596
MEDIAN FEMALE EARNINGS
86.6/ 100
METRIC RATING
137th/ 347
METRIC RANK
$36,424
MEDIAN FEMALE EARNINGS
0.1/ 100
METRIC RATING
278th/ 347
METRIC RANK
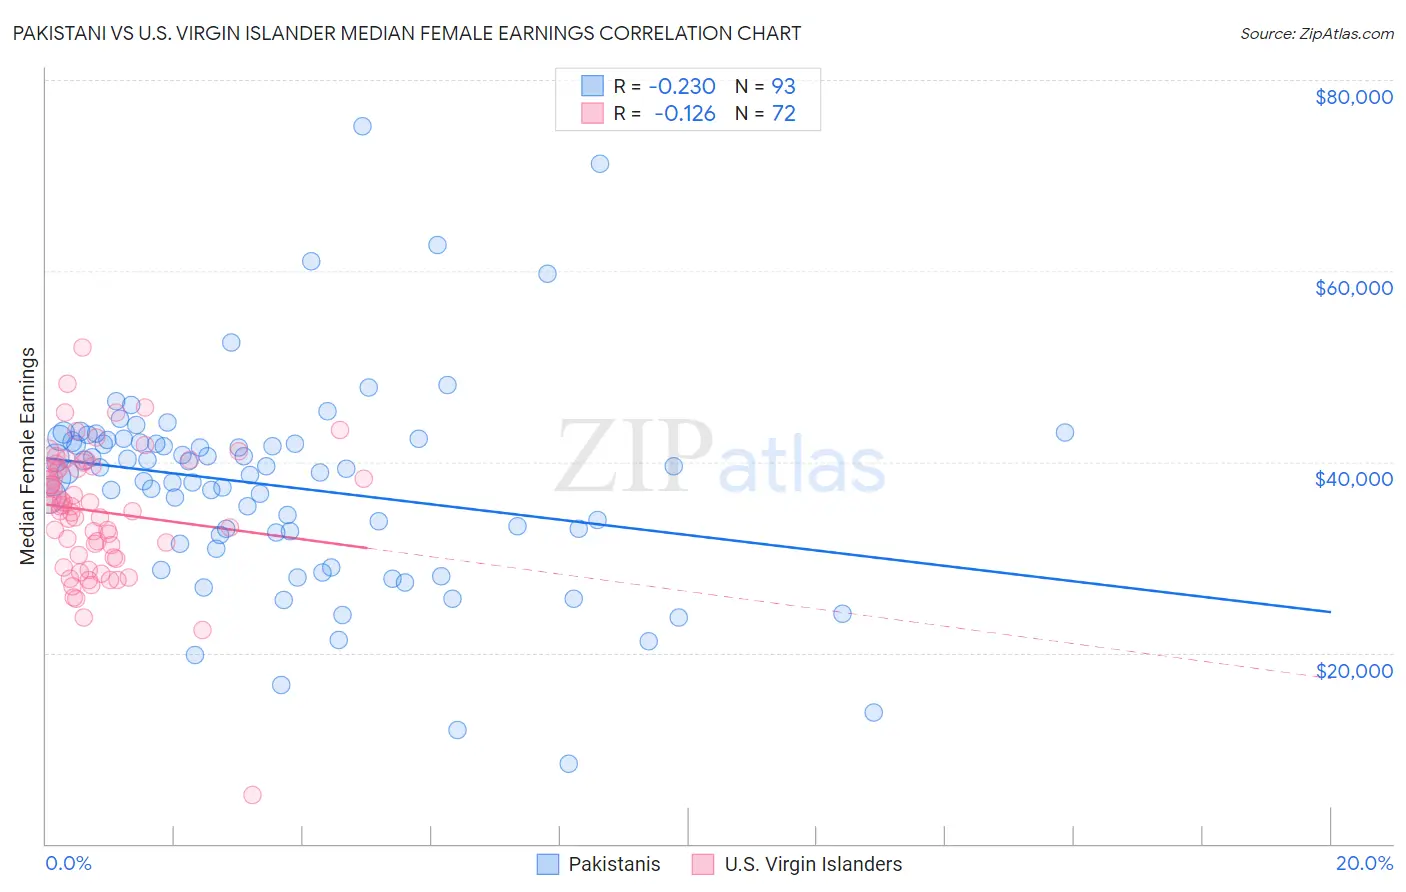
Pakistani vs U.S. Virgin Islander Median Female Earnings Correlation Chart
The statistical analysis conducted on geographies consisting of 335,277,808 people shows a weak negative correlation between the proportion of Pakistanis and median female earnings in the United States with a correlation coefficient (R) of -0.230 and weighted average of $40,596. Similarly, the statistical analysis conducted on geographies consisting of 87,518,973 people shows a poor negative correlation between the proportion of U.S. Virgin Islanders and median female earnings in the United States with a correlation coefficient (R) of -0.126 and weighted average of $36,424, a difference of 11.5%.
Median Female Earnings Correlation Summary
| Measurement | Pakistani | U.S. Virgin Islander |
| Minimum | $8,380 | $5,057 |
| Maximum | $75,132 | $51,985 |
| Range | $66,752 | $46,928 |
| Mean | $37,425 | $34,778 |
| Median | $38,904 | $35,393 |
| Interquartile 25% (IQ1) | $31,921 | $30,098 |
| Interquartile 75% (IQ3) | $42,191 | $39,427 |
| Interquartile Range (IQR) | $10,270 | $9,329 |
| Standard Deviation (Sample) | $10,860 | $6,997 |
| Standard Deviation (Population) | $10,802 | $6,948 |
Similar Demographics by Median Female Earnings
Demographics Similar to Pakistanis by Median Female Earnings
In terms of median female earnings, the demographic groups most similar to Pakistanis are Taiwanese ($40,576, a difference of 0.050%), Immigrants from South Eastern Asia ($40,558, a difference of 0.090%), Immigrants from Eastern Africa ($40,644, a difference of 0.12%), Serbian ($40,539, a difference of 0.14%), and Immigrants from Syria ($40,499, a difference of 0.24%).
| Demographics | Rating | Rank | Median Female Earnings |
| Immigrants | Guyana | 90.3 /100 | #130 | Exceptional $40,773 |
| Chileans | 90.0 /100 | #131 | Exceptional $40,757 |
| Immigrants | Uganda | 89.7 /100 | #132 | Excellent $40,739 |
| Syrians | 89.5 /100 | #133 | Excellent $40,727 |
| Arabs | 89.3 /100 | #134 | Excellent $40,718 |
| Immigrants | Nepal | 89.0 /100 | #135 | Excellent $40,704 |
| Immigrants | Eastern Africa | 87.7 /100 | #136 | Excellent $40,644 |
| Pakistanis | 86.6 /100 | #137 | Excellent $40,596 |
| Taiwanese | 86.1 /100 | #138 | Excellent $40,576 |
| Immigrants | South Eastern Asia | 85.7 /100 | #139 | Excellent $40,558 |
| Serbians | 85.2 /100 | #140 | Excellent $40,539 |
| Immigrants | Syria | 84.1 /100 | #141 | Excellent $40,499 |
| Sri Lankans | 84.0 /100 | #142 | Excellent $40,496 |
| Northern Europeans | 83.9 /100 | #143 | Excellent $40,491 |
| Immigrants | North Macedonia | 83.8 /100 | #144 | Excellent $40,488 |
Demographics Similar to U.S. Virgin Islanders by Median Female Earnings
In terms of median female earnings, the demographic groups most similar to U.S. Virgin Islanders are Immigrants from Caribbean ($36,414, a difference of 0.030%), Iroquois ($36,408, a difference of 0.050%), Spanish American ($36,391, a difference of 0.090%), Marshallese ($36,459, a difference of 0.10%), and Haitian ($36,374, a difference of 0.14%).
| Demographics | Rating | Rank | Median Female Earnings |
| Nicaraguans | 0.3 /100 | #271 | Tragic $36,904 |
| Immigrants | Dominican Republic | 0.3 /100 | #272 | Tragic $36,857 |
| Immigrants | Laos | 0.3 /100 | #273 | Tragic $36,841 |
| Immigrants | El Salvador | 0.2 /100 | #274 | Tragic $36,673 |
| Africans | 0.1 /100 | #275 | Tragic $36,530 |
| Central Americans | 0.1 /100 | #276 | Tragic $36,492 |
| Marshallese | 0.1 /100 | #277 | Tragic $36,459 |
| U.S. Virgin Islanders | 0.1 /100 | #278 | Tragic $36,424 |
| Immigrants | Caribbean | 0.1 /100 | #279 | Tragic $36,414 |
| Iroquois | 0.1 /100 | #280 | Tragic $36,408 |
| Spanish Americans | 0.1 /100 | #281 | Tragic $36,391 |
| Haitians | 0.1 /100 | #282 | Tragic $36,374 |
| Immigrants | Haiti | 0.1 /100 | #283 | Tragic $36,203 |
| Indonesians | 0.1 /100 | #284 | Tragic $36,140 |
| Paiute | 0.1 /100 | #285 | Tragic $36,056 |