Pakistani vs Chilean Average Family Size
COMPARE
Pakistani
Chilean
Average Family Size
Average Family Size Comparison
Pakistanis
Chileans
3.22
AVERAGE FAMILY SIZE
33.7/ 100
METRIC RATING
189th/ 347
METRIC RANK
3.23
AVERAGE FAMILY SIZE
53.2/ 100
METRIC RATING
171st/ 347
METRIC RANK
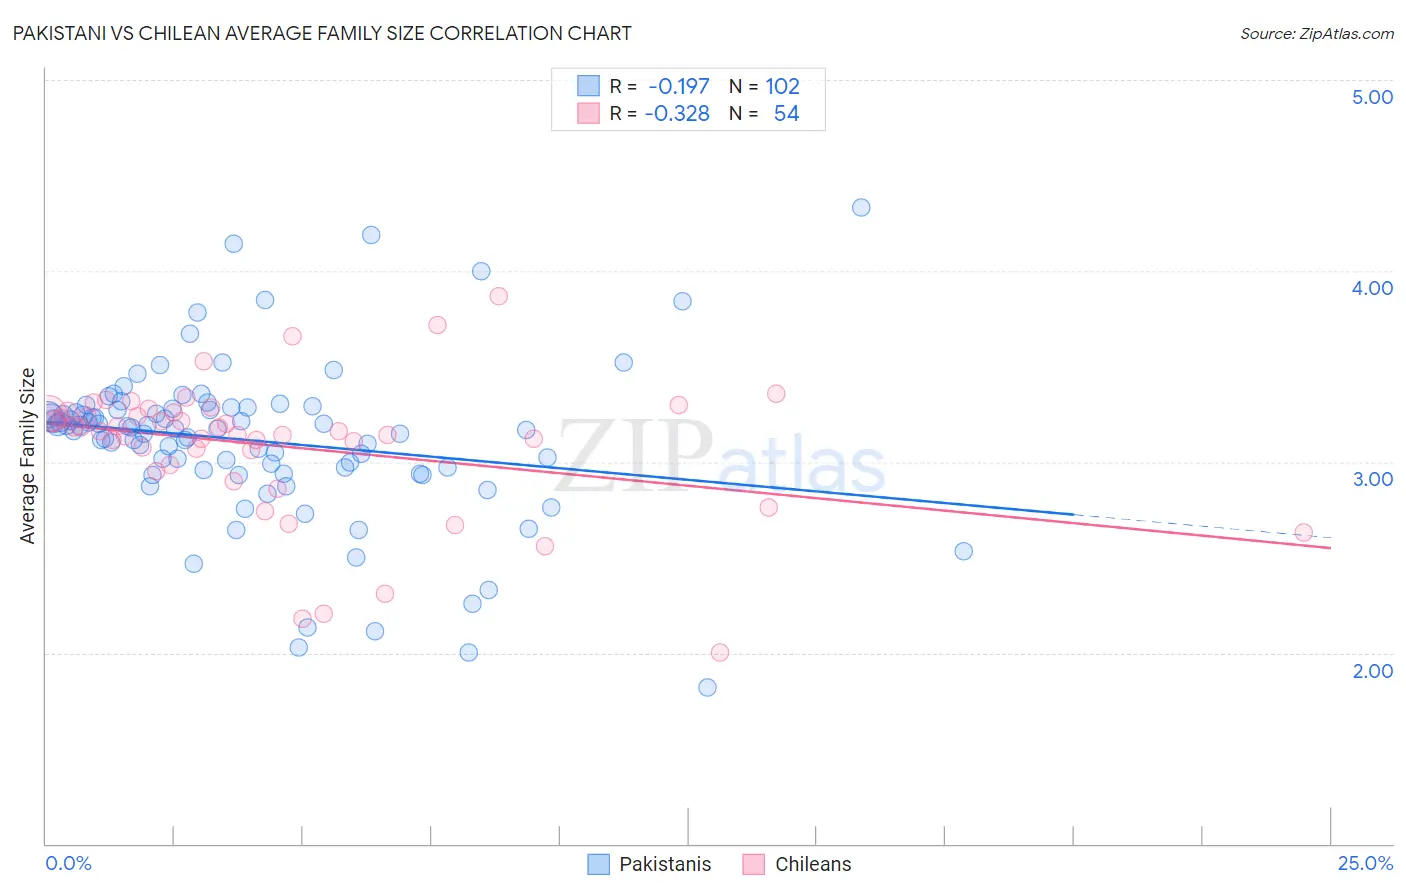
Pakistani vs Chilean Average Family Size Correlation Chart
The statistical analysis conducted on geographies consisting of 335,179,605 people shows a poor negative correlation between the proportion of Pakistanis and average family size in the United States with a correlation coefficient (R) of -0.197 and weighted average of 3.22. Similarly, the statistical analysis conducted on geographies consisting of 256,563,974 people shows a mild negative correlation between the proportion of Chileans and average family size in the United States with a correlation coefficient (R) of -0.328 and weighted average of 3.23, a difference of 0.37%.
Average Family Size Correlation Summary
| Measurement | Pakistani | Chilean |
| Minimum | 1.82 | 2.00 |
| Maximum | 4.33 | 3.87 |
| Range | 2.51 | 1.87 |
| Mean | 3.11 | 3.08 |
| Median | 3.17 | 3.16 |
| Interquartile 25% (IQ1) | 2.96 | 2.98 |
| Interquartile 75% (IQ3) | 3.28 | 3.26 |
| Interquartile Range (IQR) | 0.32 | 0.27 |
| Standard Deviation (Sample) | 0.42 | 0.36 |
| Standard Deviation (Population) | 0.42 | 0.35 |
Demographics Similar to Pakistanis and Chileans by Average Family Size
In terms of average family size, the demographic groups most similar to Pakistanis are Burmese (3.22, a difference of 0.060%), Thai (3.22, a difference of 0.090%), Immigrants from Malaysia (3.22, a difference of 0.10%), Immigrants from Sri Lanka (3.22, a difference of 0.12%), and Immigrants from Argentina (3.22, a difference of 0.12%). Similarly, the demographic groups most similar to Chileans are Arab (3.23, a difference of 0.010%), Immigrants from Congo (3.23, a difference of 0.010%), Immigrants from Uruguay (3.23, a difference of 0.020%), Immigrants from South Central Asia (3.23, a difference of 0.060%), and Immigrants from China (3.23, a difference of 0.060%).
| Demographics | Rating | Rank | Average Family Size |
| Arabs | 53.8 /100 | #170 | Average 3.23 |
| Chileans | 53.2 /100 | #171 | Average 3.23 |
| Immigrants | Congo | 52.7 /100 | #172 | Average 3.23 |
| Immigrants | Uruguay | 52.0 /100 | #173 | Average 3.23 |
| Immigrants | South Central Asia | 50.0 /100 | #174 | Average 3.23 |
| Immigrants | China | 49.9 /100 | #175 | Average 3.23 |
| Israelis | 48.7 /100 | #176 | Average 3.23 |
| Argentineans | 47.4 /100 | #177 | Average 3.23 |
| Spaniards | 47.2 /100 | #178 | Average 3.23 |
| Immigrants | Korea | 46.9 /100 | #179 | Average 3.23 |
| Palestinians | 46.6 /100 | #180 | Average 3.23 |
| Spanish | 44.8 /100 | #181 | Average 3.23 |
| Moroccans | 44.2 /100 | #182 | Average 3.22 |
| Immigrants | Northern Africa | 41.7 /100 | #183 | Average 3.22 |
| Immigrants | Eastern Asia | 40.8 /100 | #184 | Average 3.22 |
| Immigrants | Sri Lanka | 39.8 /100 | #185 | Fair 3.22 |
| Immigrants | Argentina | 39.8 /100 | #186 | Fair 3.22 |
| Immigrants | Malaysia | 39.0 /100 | #187 | Fair 3.22 |
| Thais | 38.3 /100 | #188 | Fair 3.22 |
| Pakistanis | 33.7 /100 | #189 | Fair 3.22 |
| Burmese | 31.0 /100 | #190 | Fair 3.22 |