Pakistani vs Dutch West Indian Average Family Size
COMPARE
Pakistani
Dutch West Indian
Average Family Size
Average Family Size Comparison
Pakistanis
Dutch West Indians
3.22
AVERAGE FAMILY SIZE
33.7/ 100
METRIC RATING
189th/ 347
METRIC RANK
3.23
AVERAGE FAMILY SIZE
56.9/ 100
METRIC RATING
167th/ 347
METRIC RANK
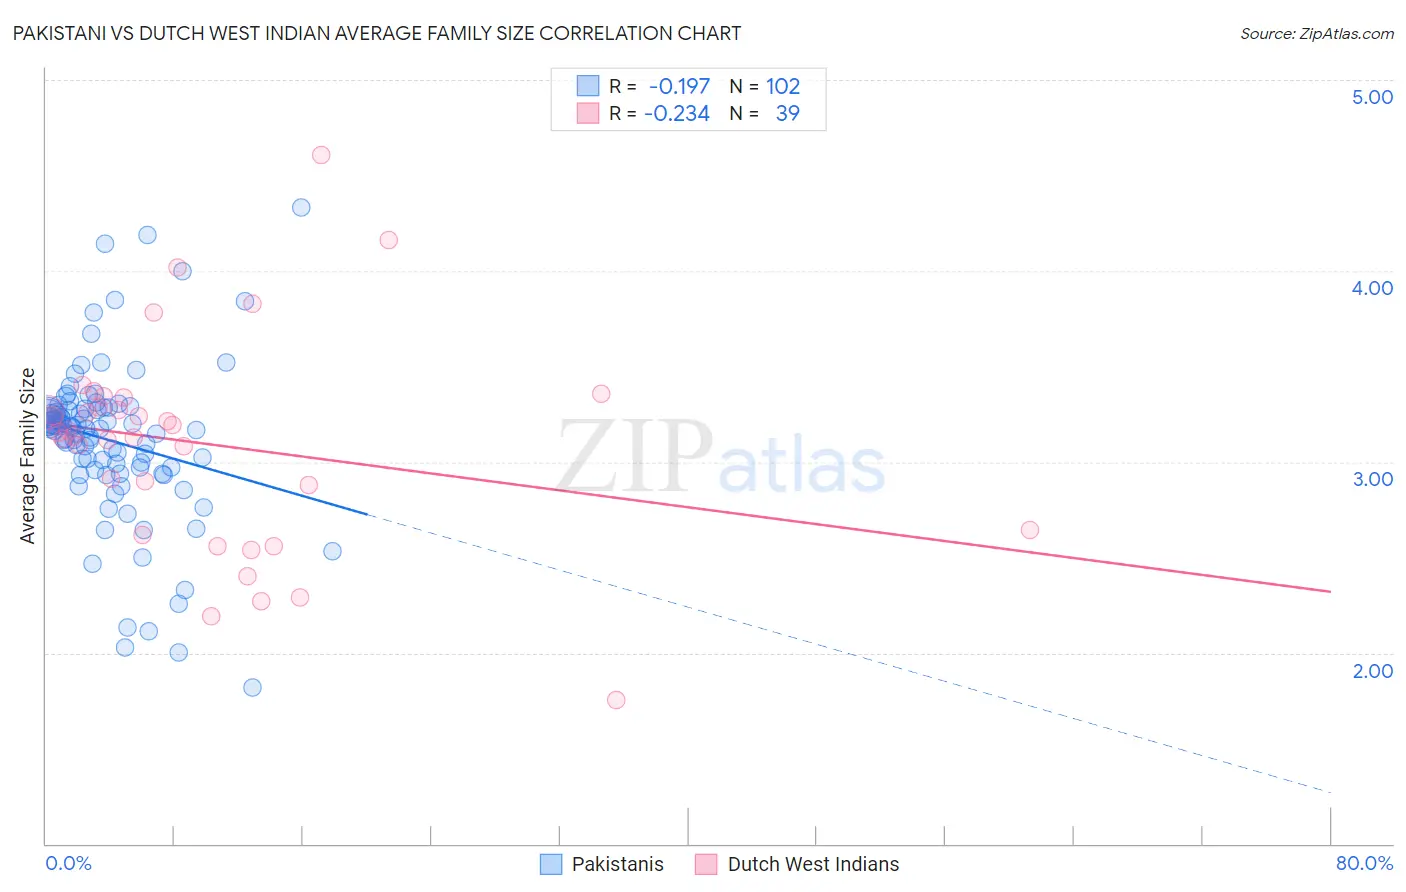
Pakistani vs Dutch West Indian Average Family Size Correlation Chart
The statistical analysis conducted on geographies consisting of 335,179,605 people shows a poor negative correlation between the proportion of Pakistanis and average family size in the United States with a correlation coefficient (R) of -0.197 and weighted average of 3.22. Similarly, the statistical analysis conducted on geographies consisting of 85,766,577 people shows a weak negative correlation between the proportion of Dutch West Indians and average family size in the United States with a correlation coefficient (R) of -0.234 and weighted average of 3.23, a difference of 0.44%.
Average Family Size Correlation Summary
| Measurement | Pakistani | Dutch West Indian |
| Minimum | 1.82 | 1.75 |
| Maximum | 4.33 | 4.61 |
| Range | 2.51 | 2.86 |
| Mean | 3.11 | 3.09 |
| Median | 3.17 | 3.15 |
| Interquartile 25% (IQ1) | 2.96 | 2.64 |
| Interquartile 75% (IQ3) | 3.28 | 3.33 |
| Interquartile Range (IQR) | 0.32 | 0.69 |
| Standard Deviation (Sample) | 0.42 | 0.56 |
| Standard Deviation (Population) | 0.42 | 0.55 |
Similar Demographics by Average Family Size
Demographics Similar to Pakistanis by Average Family Size
In terms of average family size, the demographic groups most similar to Pakistanis are Burmese (3.22, a difference of 0.060%), Immigrants from Zaire (3.22, a difference of 0.070%), Immigrants from Eastern Africa (3.22, a difference of 0.080%), Thai (3.22, a difference of 0.090%), and Immigrants from Israel (3.22, a difference of 0.090%).
| Demographics | Rating | Rank | Average Family Size |
| Moroccans | 44.2 /100 | #182 | Average 3.22 |
| Immigrants | Northern Africa | 41.7 /100 | #183 | Average 3.22 |
| Immigrants | Eastern Asia | 40.8 /100 | #184 | Average 3.22 |
| Immigrants | Sri Lanka | 39.8 /100 | #185 | Fair 3.22 |
| Immigrants | Argentina | 39.8 /100 | #186 | Fair 3.22 |
| Immigrants | Malaysia | 39.0 /100 | #187 | Fair 3.22 |
| Thais | 38.3 /100 | #188 | Fair 3.22 |
| Pakistanis | 33.7 /100 | #189 | Fair 3.22 |
| Burmese | 31.0 /100 | #190 | Fair 3.22 |
| Immigrants | Zaire | 30.5 /100 | #191 | Fair 3.22 |
| Immigrants | Eastern Africa | 30.1 /100 | #192 | Fair 3.22 |
| Immigrants | Israel | 29.3 /100 | #193 | Fair 3.22 |
| Immigrants | Sudan | 29.1 /100 | #194 | Fair 3.22 |
| Choctaw | 28.3 /100 | #195 | Fair 3.21 |
| Senegalese | 28.2 /100 | #196 | Fair 3.21 |
Demographics Similar to Dutch West Indians by Average Family Size
In terms of average family size, the demographic groups most similar to Dutch West Indians are Immigrants from Senegal (3.23, a difference of 0.010%), Egyptian (3.23, a difference of 0.030%), Ugandan (3.23, a difference of 0.030%), Uruguayan (3.23, a difference of 0.040%), and Taiwanese (3.23, a difference of 0.050%).
| Demographics | Rating | Rank | Average Family Size |
| Immigrants | Iraq | 63.7 /100 | #160 | Good 3.24 |
| Immigrants | Chile | 63.2 /100 | #161 | Good 3.24 |
| Immigrants | Uganda | 60.1 /100 | #162 | Good 3.23 |
| Uruguayans | 58.8 /100 | #163 | Average 3.23 |
| Egyptians | 58.6 /100 | #164 | Average 3.23 |
| Ugandans | 58.4 /100 | #165 | Average 3.23 |
| Immigrants | Senegal | 57.5 /100 | #166 | Average 3.23 |
| Dutch West Indians | 56.9 /100 | #167 | Average 3.23 |
| Taiwanese | 54.2 /100 | #168 | Average 3.23 |
| Aleuts | 54.1 /100 | #169 | Average 3.23 |
| Arabs | 53.8 /100 | #170 | Average 3.23 |
| Chileans | 53.2 /100 | #171 | Average 3.23 |
| Immigrants | Congo | 52.7 /100 | #172 | Average 3.23 |
| Immigrants | Uruguay | 52.0 /100 | #173 | Average 3.23 |
| Immigrants | South Central Asia | 50.0 /100 | #174 | Average 3.23 |