Nigerian vs Immigrants from Poland Currently Married
COMPARE
Nigerian
Immigrants from Poland
Currently Married
Currently Married Comparison
Nigerians
Immigrants from Poland
43.4%
CURRENTLY MARRIED
0.1/ 100
METRIC RATING
274th/ 347
METRIC RANK
48.1%
CURRENTLY MARRIED
96.9/ 100
METRIC RATING
80th/ 347
METRIC RANK
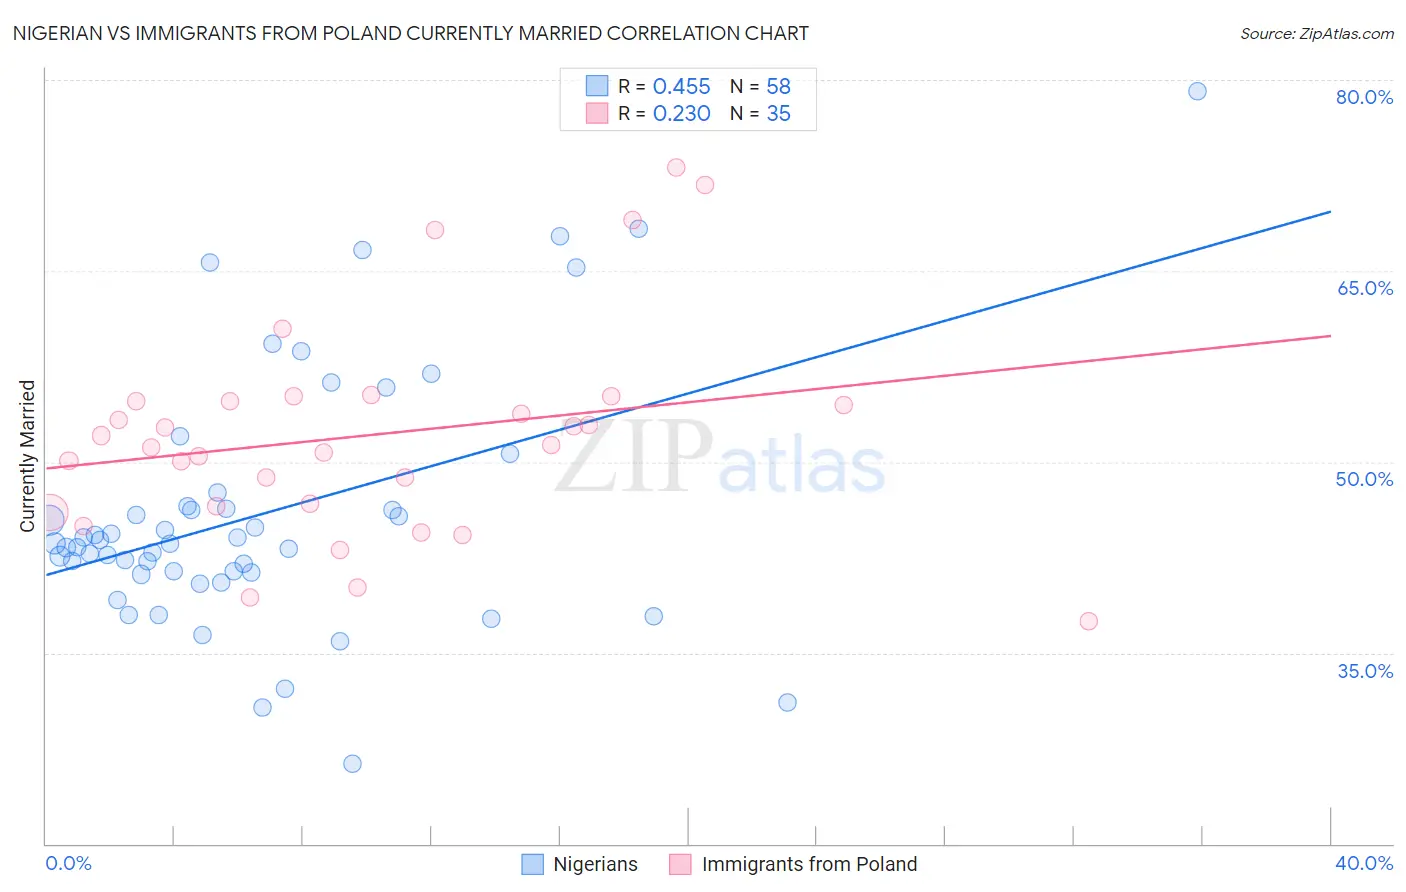
Nigerian vs Immigrants from Poland Currently Married Correlation Chart
The statistical analysis conducted on geographies consisting of 332,730,636 people shows a moderate positive correlation between the proportion of Nigerians and percentage of population currently married in the United States with a correlation coefficient (R) of 0.455 and weighted average of 43.4%. Similarly, the statistical analysis conducted on geographies consisting of 304,845,419 people shows a weak positive correlation between the proportion of Immigrants from Poland and percentage of population currently married in the United States with a correlation coefficient (R) of 0.230 and weighted average of 48.1%, a difference of 10.7%.
Currently Married Correlation Summary
| Measurement | Nigerian | Immigrants from Poland |
| Minimum | 26.3% | 37.5% |
| Maximum | 79.1% | 73.1% |
| Range | 52.8% | 35.6% |
| Mean | 46.0% | 52.1% |
| Median | 43.6% | 51.3% |
| Interquartile 25% (IQ1) | 41.3% | 46.5% |
| Interquartile 75% (IQ3) | 46.5% | 54.8% |
| Interquartile Range (IQR) | 5.2% | 8.3% |
| Standard Deviation (Sample) | 10.1% | 8.4% |
| Standard Deviation (Population) | 10.0% | 8.3% |
Similar Demographics by Currently Married
Demographics Similar to Nigerians by Currently Married
In terms of currently married, the demographic groups most similar to Nigerians are Yaqui (43.4%, a difference of 0.020%), Colville (43.4%, a difference of 0.020%), Sierra Leonean (43.4%, a difference of 0.050%), Indonesian (43.5%, a difference of 0.060%), and Immigrants from Nigeria (43.4%, a difference of 0.060%).
| Demographics | Rating | Rank | Currently Married |
| Immigrants | Eritrea | 0.1 /100 | #267 | Tragic 43.6% |
| Spanish American Indians | 0.1 /100 | #268 | Tragic 43.6% |
| Immigrants | Sudan | 0.1 /100 | #269 | Tragic 43.5% |
| Salvadorans | 0.1 /100 | #270 | Tragic 43.5% |
| Bermudans | 0.1 /100 | #271 | Tragic 43.5% |
| Indonesians | 0.1 /100 | #272 | Tragic 43.5% |
| Yaqui | 0.1 /100 | #273 | Tragic 43.4% |
| Nigerians | 0.1 /100 | #274 | Tragic 43.4% |
| Colville | 0.1 /100 | #275 | Tragic 43.4% |
| Sierra Leoneans | 0.1 /100 | #276 | Tragic 43.4% |
| Immigrants | Nigeria | 0.1 /100 | #277 | Tragic 43.4% |
| Central Americans | 0.0 /100 | #278 | Tragic 43.3% |
| Central American Indians | 0.0 /100 | #279 | Tragic 43.3% |
| Apache | 0.0 /100 | #280 | Tragic 43.2% |
| Chippewa | 0.0 /100 | #281 | Tragic 43.2% |
Demographics Similar to Immigrants from Poland by Currently Married
In terms of currently married, the demographic groups most similar to Immigrants from Poland are Immigrants from Sri Lanka (48.1%, a difference of 0.010%), Immigrants from Europe (48.1%, a difference of 0.010%), Bolivian (48.1%, a difference of 0.010%), Immigrants from Israel (48.1%, a difference of 0.020%), and Immigrants from South Africa (48.1%, a difference of 0.030%).
| Demographics | Rating | Rank | Currently Married |
| Immigrants | Eastern Asia | 97.5 /100 | #73 | Exceptional 48.2% |
| Estonians | 97.4 /100 | #74 | Exceptional 48.2% |
| Immigrants | Belarus | 97.2 /100 | #75 | Exceptional 48.1% |
| Basques | 97.2 /100 | #76 | Exceptional 48.1% |
| Slovenes | 97.1 /100 | #77 | Exceptional 48.1% |
| Immigrants | Belgium | 97.1 /100 | #78 | Exceptional 48.1% |
| Immigrants | South Africa | 97.0 /100 | #79 | Exceptional 48.1% |
| Immigrants | Poland | 96.9 /100 | #80 | Exceptional 48.1% |
| Immigrants | Sri Lanka | 96.9 /100 | #81 | Exceptional 48.1% |
| Immigrants | Europe | 96.9 /100 | #82 | Exceptional 48.1% |
| Bolivians | 96.9 /100 | #83 | Exceptional 48.1% |
| Immigrants | Israel | 96.9 /100 | #84 | Exceptional 48.1% |
| French Canadians | 96.3 /100 | #85 | Exceptional 48.0% |
| Immigrants | Japan | 96.2 /100 | #86 | Exceptional 48.0% |
| Jordanians | 96.2 /100 | #87 | Exceptional 48.0% |