Nigerian vs Immigrants from Philippines Currently Married
COMPARE
Nigerian
Immigrants from Philippines
Currently Married
Currently Married Comparison
Nigerians
Immigrants from Philippines
43.4%
CURRENTLY MARRIED
0.1/ 100
METRIC RATING
274th/ 347
METRIC RANK
47.6%
CURRENTLY MARRIED
90.2/ 100
METRIC RATING
118th/ 347
METRIC RANK
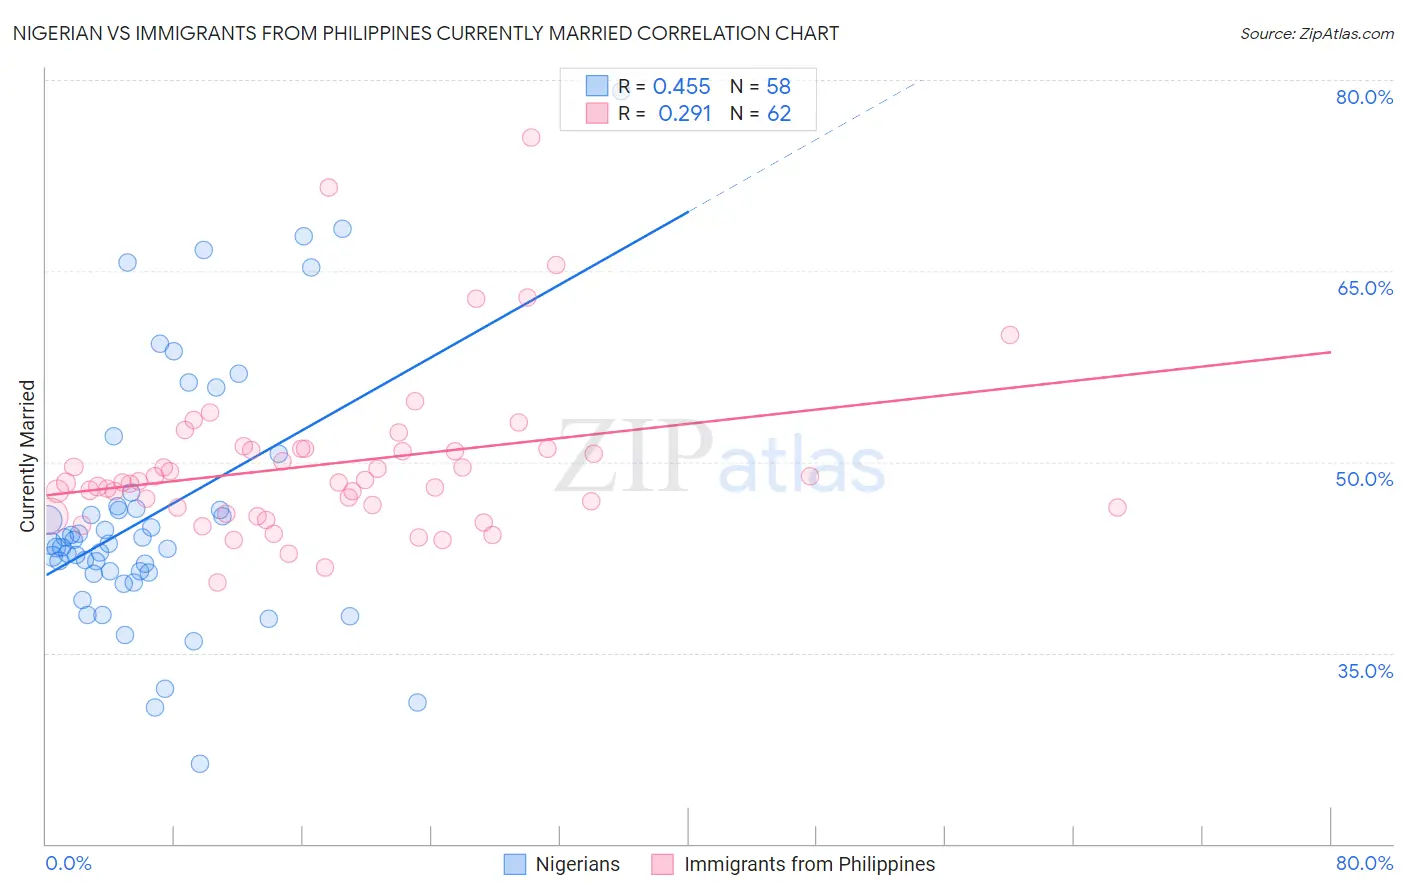
Nigerian vs Immigrants from Philippines Currently Married Correlation Chart
The statistical analysis conducted on geographies consisting of 332,730,636 people shows a moderate positive correlation between the proportion of Nigerians and percentage of population currently married in the United States with a correlation coefficient (R) of 0.455 and weighted average of 43.4%. Similarly, the statistical analysis conducted on geographies consisting of 471,263,623 people shows a weak positive correlation between the proportion of Immigrants from Philippines and percentage of population currently married in the United States with a correlation coefficient (R) of 0.291 and weighted average of 47.6%, a difference of 9.5%.
Currently Married Correlation Summary
| Measurement | Nigerian | Immigrants from Philippines |
| Minimum | 26.3% | 40.5% |
| Maximum | 79.1% | 75.5% |
| Range | 52.8% | 35.0% |
| Mean | 46.0% | 49.8% |
| Median | 43.6% | 48.4% |
| Interquartile 25% (IQ1) | 41.3% | 46.4% |
| Interquartile 75% (IQ3) | 46.5% | 51.0% |
| Interquartile Range (IQR) | 5.2% | 4.6% |
| Standard Deviation (Sample) | 10.1% | 6.4% |
| Standard Deviation (Population) | 10.0% | 6.4% |
Similar Demographics by Currently Married
Demographics Similar to Nigerians by Currently Married
In terms of currently married, the demographic groups most similar to Nigerians are Yaqui (43.4%, a difference of 0.020%), Colville (43.4%, a difference of 0.020%), Sierra Leonean (43.4%, a difference of 0.050%), Indonesian (43.5%, a difference of 0.060%), and Immigrants from Nigeria (43.4%, a difference of 0.060%).
| Demographics | Rating | Rank | Currently Married |
| Immigrants | Eritrea | 0.1 /100 | #267 | Tragic 43.6% |
| Spanish American Indians | 0.1 /100 | #268 | Tragic 43.6% |
| Immigrants | Sudan | 0.1 /100 | #269 | Tragic 43.5% |
| Salvadorans | 0.1 /100 | #270 | Tragic 43.5% |
| Bermudans | 0.1 /100 | #271 | Tragic 43.5% |
| Indonesians | 0.1 /100 | #272 | Tragic 43.5% |
| Yaqui | 0.1 /100 | #273 | Tragic 43.4% |
| Nigerians | 0.1 /100 | #274 | Tragic 43.4% |
| Colville | 0.1 /100 | #275 | Tragic 43.4% |
| Sierra Leoneans | 0.1 /100 | #276 | Tragic 43.4% |
| Immigrants | Nigeria | 0.1 /100 | #277 | Tragic 43.4% |
| Central Americans | 0.0 /100 | #278 | Tragic 43.3% |
| Central American Indians | 0.0 /100 | #279 | Tragic 43.3% |
| Apache | 0.0 /100 | #280 | Tragic 43.2% |
| Chippewa | 0.0 /100 | #281 | Tragic 43.2% |
Demographics Similar to Immigrants from Philippines by Currently Married
In terms of currently married, the demographic groups most similar to Immigrants from Philippines are Australian (47.6%, a difference of 0.0%), Puget Sound Salish (47.6%, a difference of 0.010%), Palestinian (47.6%, a difference of 0.020%), South African (47.6%, a difference of 0.030%), and Immigrants from Indonesia (47.6%, a difference of 0.030%).
| Demographics | Rating | Rank | Currently Married |
| Immigrants | Hungary | 91.2 /100 | #111 | Exceptional 47.6% |
| Immigrants | Western Europe | 91.1 /100 | #112 | Exceptional 47.6% |
| Immigrants | Denmark | 90.9 /100 | #113 | Exceptional 47.6% |
| South Africans | 90.5 /100 | #114 | Exceptional 47.6% |
| Immigrants | Indonesia | 90.5 /100 | #115 | Exceptional 47.6% |
| Palestinians | 90.4 /100 | #116 | Exceptional 47.6% |
| Puget Sound Salish | 90.3 /100 | #117 | Exceptional 47.6% |
| Immigrants | Philippines | 90.2 /100 | #118 | Exceptional 47.6% |
| Australians | 90.2 /100 | #119 | Exceptional 47.6% |
| Syrians | 88.9 /100 | #120 | Excellent 47.5% |
| Immigrants | Croatia | 88.6 /100 | #121 | Excellent 47.5% |
| Osage | 87.9 /100 | #122 | Excellent 47.5% |
| Immigrants | Kazakhstan | 87.2 /100 | #123 | Excellent 47.4% |
| Laotians | 86.6 /100 | #124 | Excellent 47.4% |
| Okinawans | 85.3 /100 | #125 | Excellent 47.4% |