Nigerian vs Immigrants from Albania Currently Married
COMPARE
Nigerian
Immigrants from Albania
Currently Married
Currently Married Comparison
Nigerians
Immigrants from Albania
43.4%
CURRENTLY MARRIED
0.1/ 100
METRIC RATING
274th/ 347
METRIC RANK
45.9%
CURRENTLY MARRIED
14.5/ 100
METRIC RATING
202nd/ 347
METRIC RANK
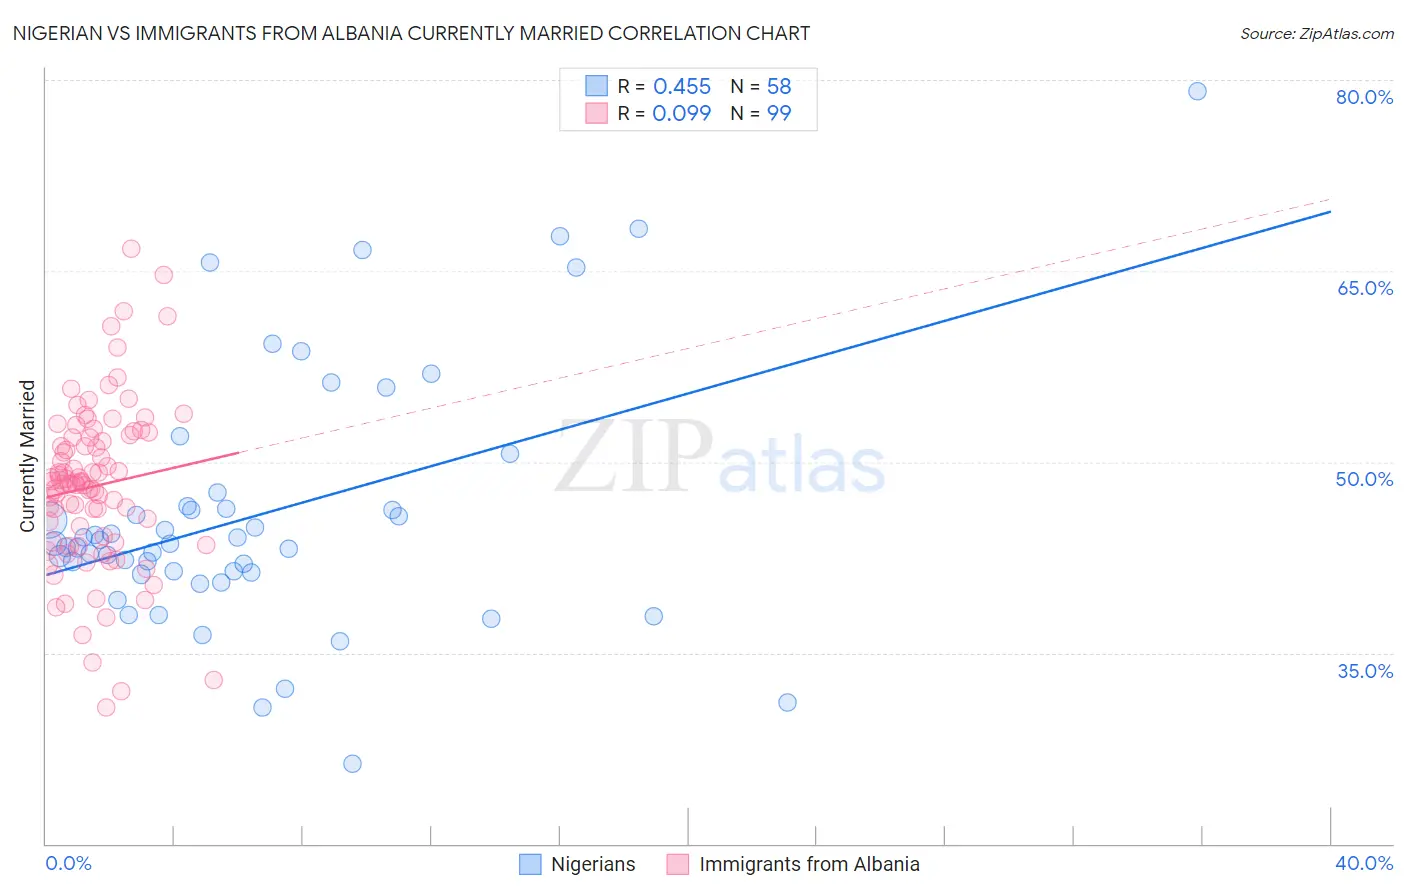
Nigerian vs Immigrants from Albania Currently Married Correlation Chart
The statistical analysis conducted on geographies consisting of 332,730,636 people shows a moderate positive correlation between the proportion of Nigerians and percentage of population currently married in the United States with a correlation coefficient (R) of 0.455 and weighted average of 43.4%. Similarly, the statistical analysis conducted on geographies consisting of 119,394,885 people shows a slight positive correlation between the proportion of Immigrants from Albania and percentage of population currently married in the United States with a correlation coefficient (R) of 0.099 and weighted average of 45.9%, a difference of 5.6%.
Currently Married Correlation Summary
| Measurement | Nigerian | Immigrants from Albania |
| Minimum | 26.3% | 30.7% |
| Maximum | 79.1% | 66.7% |
| Range | 52.8% | 36.0% |
| Mean | 46.0% | 48.1% |
| Median | 43.6% | 48.4% |
| Interquartile 25% (IQ1) | 41.3% | 43.7% |
| Interquartile 75% (IQ3) | 46.5% | 51.9% |
| Interquartile Range (IQR) | 5.2% | 8.2% |
| Standard Deviation (Sample) | 10.1% | 6.5% |
| Standard Deviation (Population) | 10.0% | 6.4% |
Similar Demographics by Currently Married
Demographics Similar to Nigerians by Currently Married
In terms of currently married, the demographic groups most similar to Nigerians are Yaqui (43.4%, a difference of 0.020%), Colville (43.4%, a difference of 0.020%), Sierra Leonean (43.4%, a difference of 0.050%), Indonesian (43.5%, a difference of 0.060%), and Immigrants from Nigeria (43.4%, a difference of 0.060%).
| Demographics | Rating | Rank | Currently Married |
| Immigrants | Eritrea | 0.1 /100 | #267 | Tragic 43.6% |
| Spanish American Indians | 0.1 /100 | #268 | Tragic 43.6% |
| Immigrants | Sudan | 0.1 /100 | #269 | Tragic 43.5% |
| Salvadorans | 0.1 /100 | #270 | Tragic 43.5% |
| Bermudans | 0.1 /100 | #271 | Tragic 43.5% |
| Indonesians | 0.1 /100 | #272 | Tragic 43.5% |
| Yaqui | 0.1 /100 | #273 | Tragic 43.4% |
| Nigerians | 0.1 /100 | #274 | Tragic 43.4% |
| Colville | 0.1 /100 | #275 | Tragic 43.4% |
| Sierra Leoneans | 0.1 /100 | #276 | Tragic 43.4% |
| Immigrants | Nigeria | 0.1 /100 | #277 | Tragic 43.4% |
| Central Americans | 0.0 /100 | #278 | Tragic 43.3% |
| Central American Indians | 0.0 /100 | #279 | Tragic 43.3% |
| Apache | 0.0 /100 | #280 | Tragic 43.2% |
| Chippewa | 0.0 /100 | #281 | Tragic 43.2% |
Demographics Similar to Immigrants from Albania by Currently Married
In terms of currently married, the demographic groups most similar to Immigrants from Albania are Malaysian (45.9%, a difference of 0.060%), Creek (46.0%, a difference of 0.19%), Taiwanese (45.8%, a difference of 0.23%), Immigrants from Spain (45.8%, a difference of 0.24%), and South American Indian (45.8%, a difference of 0.25%).
| Demographics | Rating | Rank | Currently Married |
| Immigrants | Nepal | 23.7 /100 | #195 | Fair 46.1% |
| Immigrants | Bosnia and Herzegovina | 22.2 /100 | #196 | Fair 46.1% |
| Immigrants | Kuwait | 21.7 /100 | #197 | Fair 46.1% |
| Immigrants | Colombia | 21.0 /100 | #198 | Fair 46.1% |
| Immigrants | Costa Rica | 19.6 /100 | #199 | Poor 46.0% |
| Creek | 17.2 /100 | #200 | Poor 46.0% |
| Malaysians | 15.3 /100 | #201 | Poor 45.9% |
| Immigrants | Albania | 14.5 /100 | #202 | Poor 45.9% |
| Taiwanese | 11.7 /100 | #203 | Poor 45.8% |
| Immigrants | Spain | 11.6 /100 | #204 | Poor 45.8% |
| South American Indians | 11.5 /100 | #205 | Poor 45.8% |
| Immigrants | Immigrants | 11.2 /100 | #206 | Poor 45.8% |
| Immigrants | South America | 10.8 /100 | #207 | Poor 45.7% |
| Alsatians | 10.8 /100 | #208 | Poor 45.7% |
| Immigrants | Micronesia | 8.8 /100 | #209 | Tragic 45.6% |