Immigrants from Trinidad and Tobago vs Immigrants from Latin America Married-couple Households
COMPARE
Immigrants from Trinidad and Tobago
Immigrants from Latin America
Married-couple Households
Married-couple Households Comparison
Immigrants from Trinidad and Tobago
Immigrants from Latin America
41.2%
MARRIED-COUPLE HOUSEHOLDS
0.0/ 100
METRIC RATING
309th/ 347
METRIC RANK
44.7%
MARRIED-COUPLE HOUSEHOLDS
1.6/ 100
METRIC RATING
229th/ 347
METRIC RANK
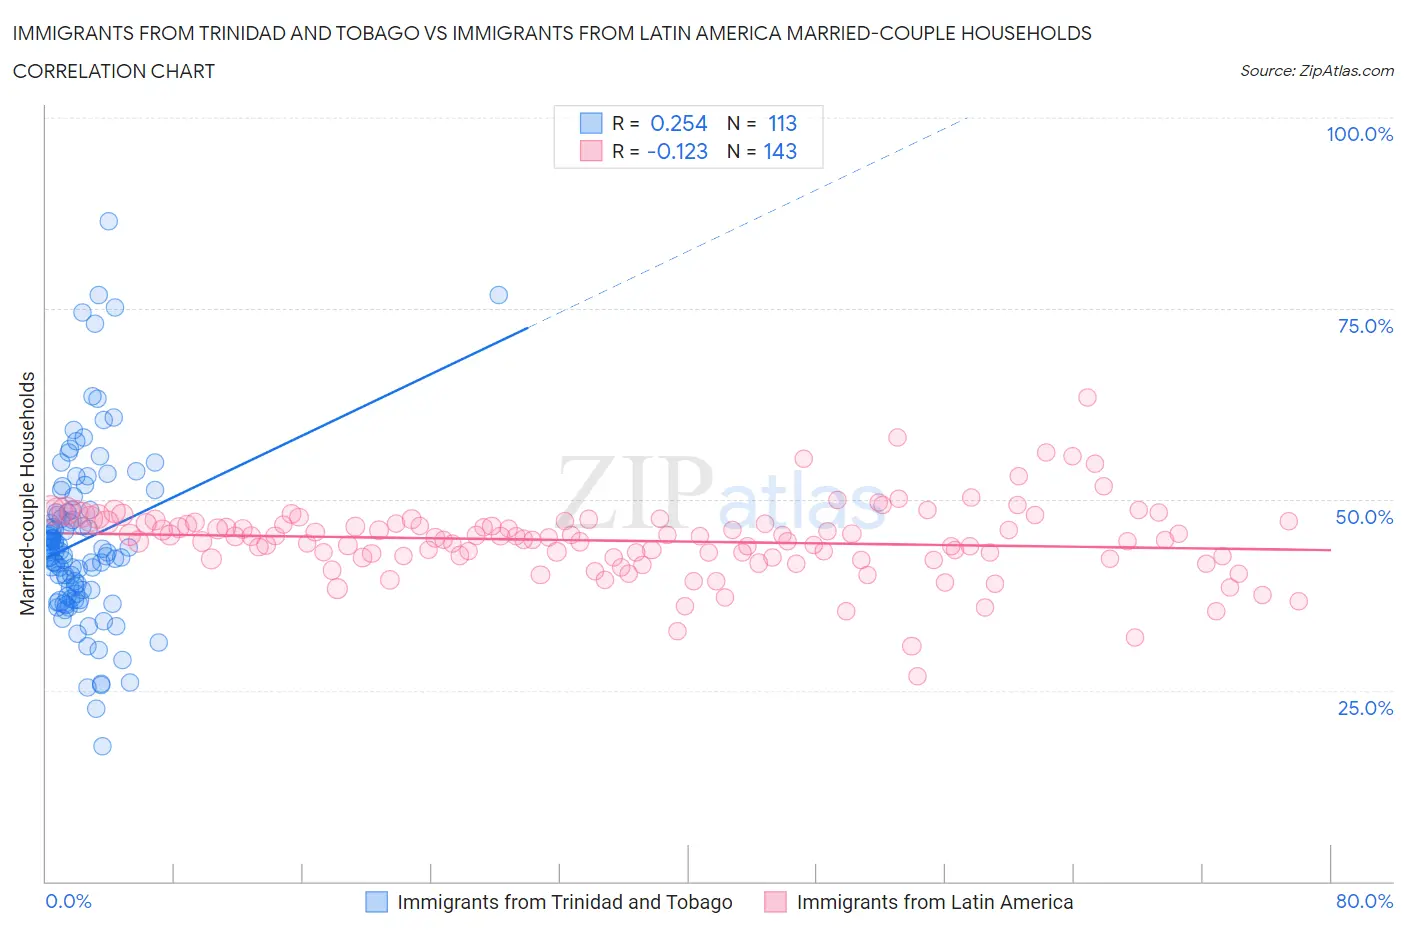
Immigrants from Trinidad and Tobago vs Immigrants from Latin America Married-couple Households Correlation Chart
The statistical analysis conducted on geographies consisting of 223,481,382 people shows a weak positive correlation between the proportion of Immigrants from Trinidad and Tobago and percentage of married-couple family households in the United States with a correlation coefficient (R) of 0.254 and weighted average of 41.2%. Similarly, the statistical analysis conducted on geographies consisting of 557,974,846 people shows a poor negative correlation between the proportion of Immigrants from Latin America and percentage of married-couple family households in the United States with a correlation coefficient (R) of -0.123 and weighted average of 44.7%, a difference of 8.4%.
Married-couple Households Correlation Summary
| Measurement | Immigrants from Trinidad and Tobago | Immigrants from Latin America |
| Minimum | 17.7% | 26.9% |
| Maximum | 86.4% | 63.3% |
| Range | 68.7% | 36.4% |
| Mean | 44.7% | 44.6% |
| Median | 43.2% | 45.0% |
| Interquartile 25% (IQ1) | 37.5% | 42.4% |
| Interquartile 75% (IQ3) | 48.6% | 47.0% |
| Interquartile Range (IQR) | 11.2% | 4.7% |
| Standard Deviation (Sample) | 11.5% | 4.9% |
| Standard Deviation (Population) | 11.5% | 4.9% |
Similar Demographics by Married-couple Households
Demographics Similar to Immigrants from Trinidad and Tobago by Married-couple Households
In terms of married-couple households, the demographic groups most similar to Immigrants from Trinidad and Tobago are Haitian (41.2%, a difference of 0.070%), Crow (41.4%, a difference of 0.35%), Guyanese (41.4%, a difference of 0.36%), Immigrants from Western Africa (41.4%, a difference of 0.36%), and Colville (41.0%, a difference of 0.57%).
| Demographics | Rating | Rank | Married-couple Households |
| Immigrants | Honduras | 0.0 /100 | #302 | Tragic 41.6% |
| Sub-Saharan Africans | 0.0 /100 | #303 | Tragic 41.6% |
| Immigrants | Guyana | 0.0 /100 | #304 | Tragic 41.6% |
| Sioux | 0.0 /100 | #305 | Tragic 41.5% |
| Guyanese | 0.0 /100 | #306 | Tragic 41.4% |
| Immigrants | Western Africa | 0.0 /100 | #307 | Tragic 41.4% |
| Crow | 0.0 /100 | #308 | Tragic 41.4% |
| Immigrants | Trinidad and Tobago | 0.0 /100 | #309 | Tragic 41.2% |
| Haitians | 0.0 /100 | #310 | Tragic 41.2% |
| Colville | 0.0 /100 | #311 | Tragic 41.0% |
| Africans | 0.0 /100 | #312 | Tragic 40.9% |
| Immigrants | Haiti | 0.0 /100 | #313 | Tragic 40.9% |
| Jamaicans | 0.0 /100 | #314 | Tragic 40.9% |
| Trinidadians and Tobagonians | 0.0 /100 | #315 | Tragic 40.9% |
| Immigrants | Caribbean | 0.0 /100 | #316 | Tragic 40.8% |
Demographics Similar to Immigrants from Latin America by Married-couple Households
In terms of married-couple households, the demographic groups most similar to Immigrants from Latin America are Soviet Union (44.6%, a difference of 0.040%), Kenyan (44.7%, a difference of 0.050%), Houma (44.6%, a difference of 0.050%), Marshallese (44.6%, a difference of 0.050%), and Immigrants from Uganda (44.6%, a difference of 0.090%).
| Demographics | Rating | Rank | Married-couple Households |
| Immigrants | Laos | 4.6 /100 | #222 | Tragic 45.1% |
| Immigrants | Cambodia | 2.7 /100 | #223 | Tragic 44.9% |
| Immigrants | Micronesia | 2.6 /100 | #224 | Tragic 44.9% |
| Dutch West Indians | 2.6 /100 | #225 | Tragic 44.9% |
| Alsatians | 2.3 /100 | #226 | Tragic 44.8% |
| Salvadorans | 1.9 /100 | #227 | Tragic 44.7% |
| Kenyans | 1.7 /100 | #228 | Tragic 44.7% |
| Immigrants | Latin America | 1.6 /100 | #229 | Tragic 44.7% |
| Soviet Union | 1.6 /100 | #230 | Tragic 44.6% |
| Houma | 1.5 /100 | #231 | Tragic 44.6% |
| Marshallese | 1.5 /100 | #232 | Tragic 44.6% |
| Immigrants | Uganda | 1.5 /100 | #233 | Tragic 44.6% |
| Immigrants | Panama | 1.3 /100 | #234 | Tragic 44.6% |
| Immigrants | Nicaragua | 1.2 /100 | #235 | Tragic 44.5% |
| Yaqui | 1.2 /100 | #236 | Tragic 44.5% |