Immigrants from Trinidad and Tobago vs Apache Married-couple Households
COMPARE
Immigrants from Trinidad and Tobago
Apache
Married-couple Households
Married-couple Households Comparison
Immigrants from Trinidad and Tobago
Apache
41.2%
MARRIED-COUPLE HOUSEHOLDS
0.0/ 100
METRIC RATING
309th/ 347
METRIC RANK
43.9%
MARRIED-COUPLE HOUSEHOLDS
0.3/ 100
METRIC RATING
254th/ 347
METRIC RANK
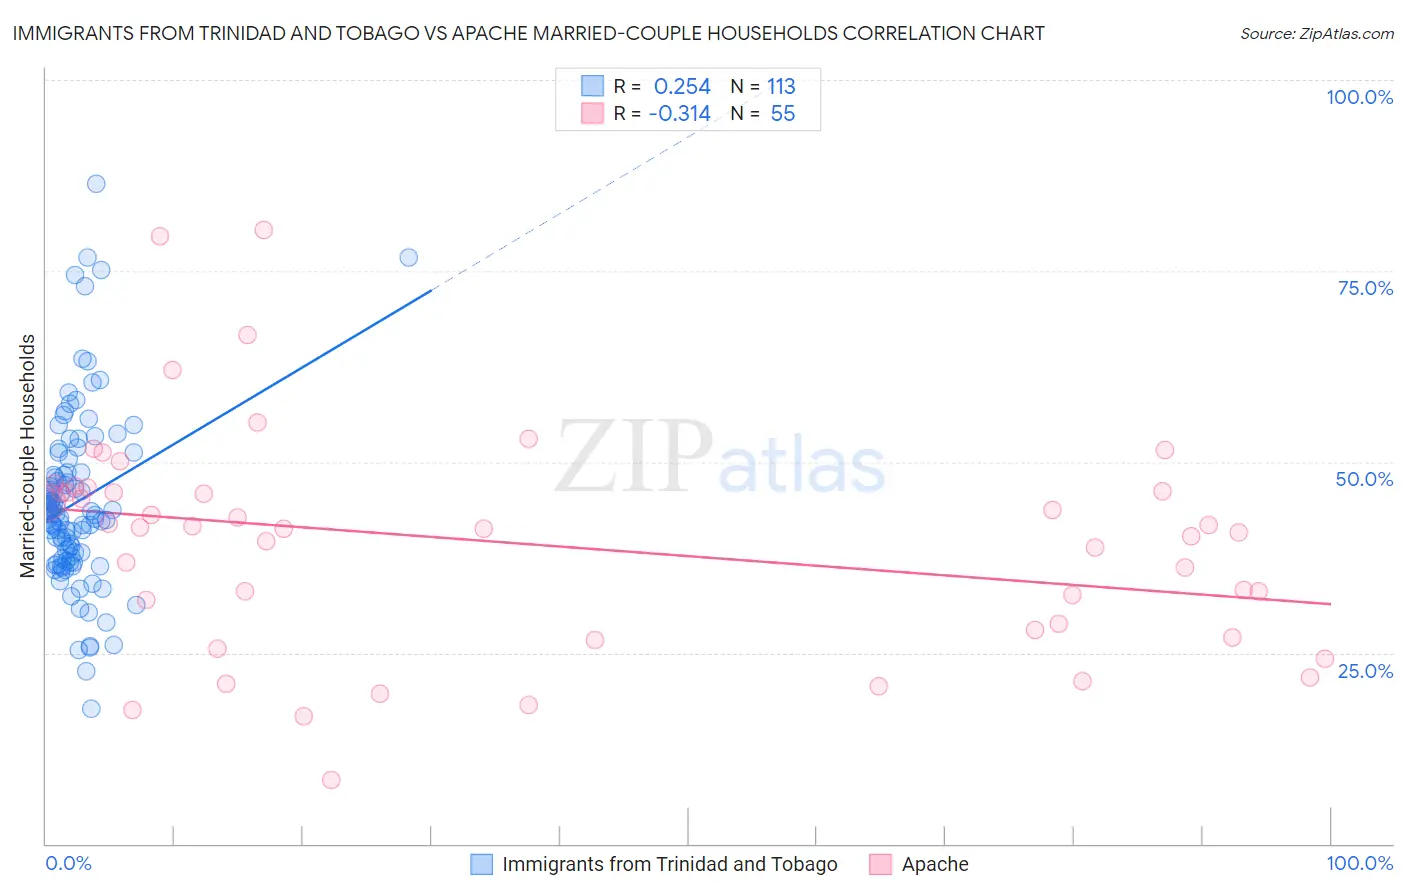
Immigrants from Trinidad and Tobago vs Apache Married-couple Households Correlation Chart
The statistical analysis conducted on geographies consisting of 223,481,382 people shows a weak positive correlation between the proportion of Immigrants from Trinidad and Tobago and percentage of married-couple family households in the United States with a correlation coefficient (R) of 0.254 and weighted average of 41.2%. Similarly, the statistical analysis conducted on geographies consisting of 231,040,334 people shows a mild negative correlation between the proportion of Apache and percentage of married-couple family households in the United States with a correlation coefficient (R) of -0.314 and weighted average of 43.9%, a difference of 6.6%.
Married-couple Households Correlation Summary
| Measurement | Immigrants from Trinidad and Tobago | Apache |
| Minimum | 17.7% | 8.3% |
| Maximum | 86.4% | 80.3% |
| Range | 68.7% | 72.0% |
| Mean | 44.7% | 39.3% |
| Median | 43.2% | 41.3% |
| Interquartile 25% (IQ1) | 37.5% | 28.0% |
| Interquartile 75% (IQ3) | 48.6% | 46.1% |
| Interquartile Range (IQR) | 11.2% | 18.1% |
| Standard Deviation (Sample) | 11.5% | 14.5% |
| Standard Deviation (Population) | 11.5% | 14.4% |
Similar Demographics by Married-couple Households
Demographics Similar to Immigrants from Trinidad and Tobago by Married-couple Households
In terms of married-couple households, the demographic groups most similar to Immigrants from Trinidad and Tobago are Haitian (41.2%, a difference of 0.070%), Crow (41.4%, a difference of 0.35%), Guyanese (41.4%, a difference of 0.36%), Immigrants from Western Africa (41.4%, a difference of 0.36%), and Colville (41.0%, a difference of 0.57%).
| Demographics | Rating | Rank | Married-couple Households |
| Immigrants | Honduras | 0.0 /100 | #302 | Tragic 41.6% |
| Sub-Saharan Africans | 0.0 /100 | #303 | Tragic 41.6% |
| Immigrants | Guyana | 0.0 /100 | #304 | Tragic 41.6% |
| Sioux | 0.0 /100 | #305 | Tragic 41.5% |
| Guyanese | 0.0 /100 | #306 | Tragic 41.4% |
| Immigrants | Western Africa | 0.0 /100 | #307 | Tragic 41.4% |
| Crow | 0.0 /100 | #308 | Tragic 41.4% |
| Immigrants | Trinidad and Tobago | 0.0 /100 | #309 | Tragic 41.2% |
| Haitians | 0.0 /100 | #310 | Tragic 41.2% |
| Colville | 0.0 /100 | #311 | Tragic 41.0% |
| Africans | 0.0 /100 | #312 | Tragic 40.9% |
| Immigrants | Haiti | 0.0 /100 | #313 | Tragic 40.9% |
| Jamaicans | 0.0 /100 | #314 | Tragic 40.9% |
| Trinidadians and Tobagonians | 0.0 /100 | #315 | Tragic 40.9% |
| Immigrants | Caribbean | 0.0 /100 | #316 | Tragic 40.8% |
Demographics Similar to Apache by Married-couple Households
In terms of married-couple households, the demographic groups most similar to Apache are Shoshone (43.9%, a difference of 0.020%), Central American (43.9%, a difference of 0.050%), Ugandan (43.8%, a difference of 0.16%), Seminole (44.0%, a difference of 0.17%), and German Russian (44.0%, a difference of 0.24%).
| Demographics | Rating | Rank | Married-couple Households |
| Immigrants | Morocco | 0.6 /100 | #247 | Tragic 44.2% |
| Yup'ik | 0.4 /100 | #248 | Tragic 44.1% |
| Immigrants | Kenya | 0.4 /100 | #249 | Tragic 44.1% |
| French American Indians | 0.4 /100 | #250 | Tragic 44.1% |
| German Russians | 0.4 /100 | #251 | Tragic 44.0% |
| Seminole | 0.4 /100 | #252 | Tragic 44.0% |
| Central Americans | 0.3 /100 | #253 | Tragic 43.9% |
| Apache | 0.3 /100 | #254 | Tragic 43.9% |
| Shoshone | 0.3 /100 | #255 | Tragic 43.9% |
| Ugandans | 0.3 /100 | #256 | Tragic 43.8% |
| Blackfeet | 0.2 /100 | #257 | Tragic 43.8% |
| Central American Indians | 0.2 /100 | #258 | Tragic 43.8% |
| Iroquois | 0.2 /100 | #259 | Tragic 43.7% |
| Immigrants | Cameroon | 0.2 /100 | #260 | Tragic 43.7% |
| Alaskan Athabascans | 0.2 /100 | #261 | Tragic 43.6% |