Immigrants from Trinidad and Tobago vs Immigrants from Eritrea Married-couple Households
COMPARE
Immigrants from Trinidad and Tobago
Immigrants from Eritrea
Married-couple Households
Married-couple Households Comparison
Immigrants from Trinidad and Tobago
Immigrants from Eritrea
41.2%
MARRIED-COUPLE HOUSEHOLDS
0.0/ 100
METRIC RATING
309th/ 347
METRIC RANK
42.1%
MARRIED-COUPLE HOUSEHOLDS
0.0/ 100
METRIC RATING
288th/ 347
METRIC RANK
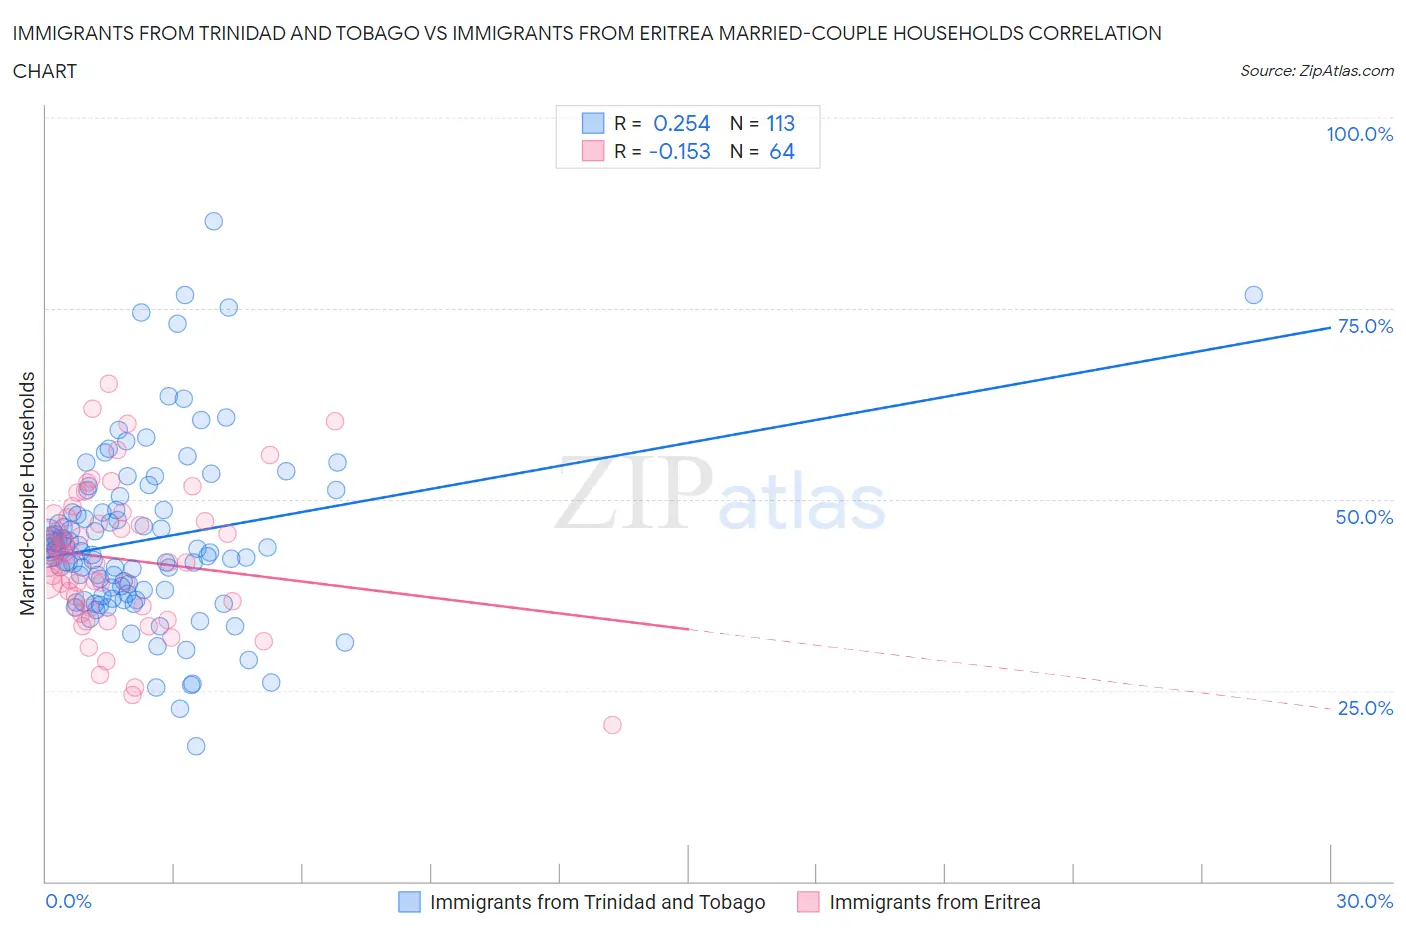
Immigrants from Trinidad and Tobago vs Immigrants from Eritrea Married-couple Households Correlation Chart
The statistical analysis conducted on geographies consisting of 223,481,382 people shows a weak positive correlation between the proportion of Immigrants from Trinidad and Tobago and percentage of married-couple family households in the United States with a correlation coefficient (R) of 0.254 and weighted average of 41.2%. Similarly, the statistical analysis conducted on geographies consisting of 104,844,596 people shows a poor negative correlation between the proportion of Immigrants from Eritrea and percentage of married-couple family households in the United States with a correlation coefficient (R) of -0.153 and weighted average of 42.1%, a difference of 2.2%.
Married-couple Households Correlation Summary
| Measurement | Immigrants from Trinidad and Tobago | Immigrants from Eritrea |
| Minimum | 17.7% | 20.5% |
| Maximum | 86.4% | 65.2% |
| Range | 68.7% | 44.8% |
| Mean | 44.7% | 42.2% |
| Median | 43.2% | 41.7% |
| Interquartile 25% (IQ1) | 37.5% | 35.9% |
| Interquartile 75% (IQ3) | 48.6% | 47.4% |
| Interquartile Range (IQR) | 11.2% | 11.5% |
| Standard Deviation (Sample) | 11.5% | 9.2% |
| Standard Deviation (Population) | 11.5% | 9.1% |
Similar Demographics by Married-couple Households
Demographics Similar to Immigrants from Trinidad and Tobago by Married-couple Households
In terms of married-couple households, the demographic groups most similar to Immigrants from Trinidad and Tobago are Haitian (41.2%, a difference of 0.070%), Crow (41.4%, a difference of 0.35%), Guyanese (41.4%, a difference of 0.36%), Immigrants from Western Africa (41.4%, a difference of 0.36%), and Colville (41.0%, a difference of 0.57%).
| Demographics | Rating | Rank | Married-couple Households |
| Immigrants | Honduras | 0.0 /100 | #302 | Tragic 41.6% |
| Sub-Saharan Africans | 0.0 /100 | #303 | Tragic 41.6% |
| Immigrants | Guyana | 0.0 /100 | #304 | Tragic 41.6% |
| Sioux | 0.0 /100 | #305 | Tragic 41.5% |
| Guyanese | 0.0 /100 | #306 | Tragic 41.4% |
| Immigrants | Western Africa | 0.0 /100 | #307 | Tragic 41.4% |
| Crow | 0.0 /100 | #308 | Tragic 41.4% |
| Immigrants | Trinidad and Tobago | 0.0 /100 | #309 | Tragic 41.2% |
| Haitians | 0.0 /100 | #310 | Tragic 41.2% |
| Colville | 0.0 /100 | #311 | Tragic 41.0% |
| Africans | 0.0 /100 | #312 | Tragic 40.9% |
| Immigrants | Haiti | 0.0 /100 | #313 | Tragic 40.9% |
| Jamaicans | 0.0 /100 | #314 | Tragic 40.9% |
| Trinidadians and Tobagonians | 0.0 /100 | #315 | Tragic 40.9% |
| Immigrants | Caribbean | 0.0 /100 | #316 | Tragic 40.8% |
Demographics Similar to Immigrants from Eritrea by Married-couple Households
In terms of married-couple households, the demographic groups most similar to Immigrants from Eritrea are Sudanese (42.1%, a difference of 0.060%), Chippewa (42.1%, a difference of 0.080%), Honduran (42.1%, a difference of 0.11%), Paiute (42.1%, a difference of 0.11%), and Indonesian (42.0%, a difference of 0.16%).
| Demographics | Rating | Rank | Married-couple Households |
| Immigrants | Guatemala | 0.0 /100 | #281 | Tragic 42.8% |
| Bermudans | 0.0 /100 | #282 | Tragic 42.4% |
| Inupiat | 0.0 /100 | #283 | Tragic 42.4% |
| Cheyenne | 0.0 /100 | #284 | Tragic 42.3% |
| Ghanaians | 0.0 /100 | #285 | Tragic 42.2% |
| Belizeans | 0.0 /100 | #286 | Tragic 42.2% |
| Chippewa | 0.0 /100 | #287 | Tragic 42.1% |
| Immigrants | Eritrea | 0.0 /100 | #288 | Tragic 42.1% |
| Sudanese | 0.0 /100 | #289 | Tragic 42.1% |
| Hondurans | 0.0 /100 | #290 | Tragic 42.1% |
| Paiute | 0.0 /100 | #291 | Tragic 42.1% |
| Indonesians | 0.0 /100 | #292 | Tragic 42.0% |
| Menominee | 0.0 /100 | #293 | Tragic 42.0% |
| Immigrants | Yemen | 0.0 /100 | #294 | Tragic 42.0% |
| Kiowa | 0.0 /100 | #295 | Tragic 42.0% |