Ethiopian vs Immigrants from Latvia Married-couple Households
COMPARE
Ethiopian
Immigrants from Latvia
Married-couple Households
Married-couple Households Comparison
Ethiopians
Immigrants from Latvia
43.2%
MARRIED-COUPLE HOUSEHOLDS
0.1/ 100
METRIC RATING
273rd/ 347
METRIC RANK
46.0%
MARRIED-COUPLE HOUSEHOLDS
26.9/ 100
METRIC RATING
189th/ 347
METRIC RANK
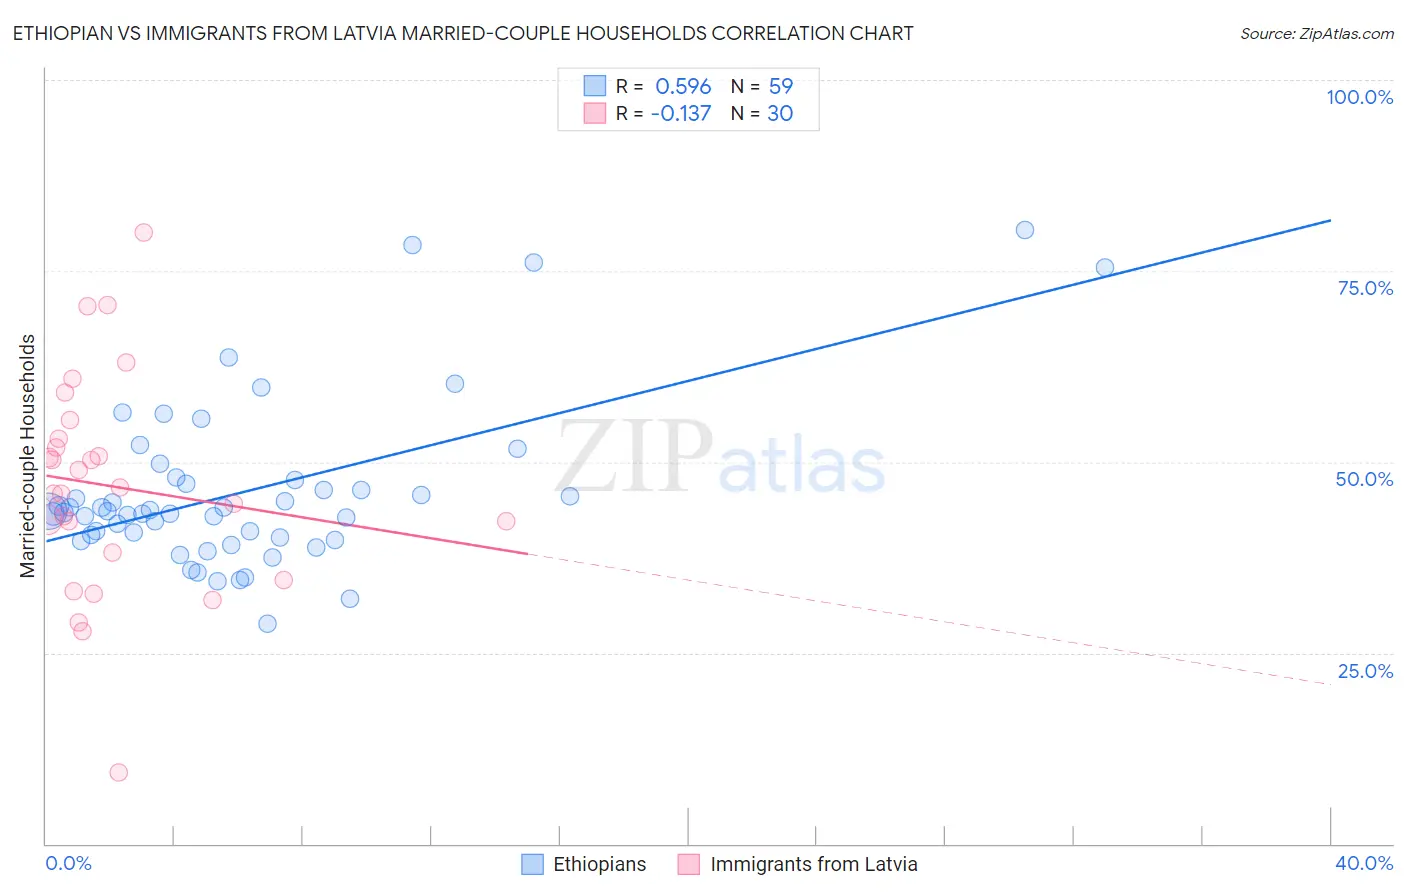
Ethiopian vs Immigrants from Latvia Married-couple Households Correlation Chart
The statistical analysis conducted on geographies consisting of 223,091,132 people shows a substantial positive correlation between the proportion of Ethiopians and percentage of married-couple family households in the United States with a correlation coefficient (R) of 0.596 and weighted average of 43.2%. Similarly, the statistical analysis conducted on geographies consisting of 113,732,502 people shows a poor negative correlation between the proportion of Immigrants from Latvia and percentage of married-couple family households in the United States with a correlation coefficient (R) of -0.137 and weighted average of 46.0%, a difference of 6.6%.
Married-couple Households Correlation Summary
| Measurement | Ethiopian | Immigrants from Latvia |
| Minimum | 28.9% | 9.2% |
| Maximum | 80.4% | 80.0% |
| Range | 51.5% | 70.8% |
| Mean | 46.2% | 46.8% |
| Median | 43.6% | 46.2% |
| Interquartile 25% (IQ1) | 40.1% | 38.2% |
| Interquartile 75% (IQ3) | 47.7% | 53.0% |
| Interquartile Range (IQR) | 7.6% | 14.8% |
| Standard Deviation (Sample) | 10.9% | 14.4% |
| Standard Deviation (Population) | 10.8% | 14.2% |
Similar Demographics by Married-couple Households
Demographics Similar to Ethiopians by Married-couple Households
In terms of married-couple households, the demographic groups most similar to Ethiopians are Nigerian (43.2%, a difference of 0.010%), Immigrants from Nigeria (43.2%, a difference of 0.10%), Immigrants from Bangladesh (43.1%, a difference of 0.15%), Guatemalan (43.3%, a difference of 0.20%), and Immigrants from Ethiopia (43.1%, a difference of 0.26%).
| Demographics | Rating | Rank | Married-couple Households |
| Ecuadorians | 0.1 /100 | #266 | Tragic 43.5% |
| Natives/Alaskans | 0.1 /100 | #267 | Tragic 43.5% |
| Immigrants | Burma/Myanmar | 0.1 /100 | #268 | Tragic 43.4% |
| Immigrants | Sierra Leone | 0.1 /100 | #269 | Tragic 43.3% |
| Yuman | 0.1 /100 | #270 | Tragic 43.3% |
| Guatemalans | 0.1 /100 | #271 | Tragic 43.3% |
| Immigrants | Nigeria | 0.1 /100 | #272 | Tragic 43.2% |
| Ethiopians | 0.1 /100 | #273 | Tragic 43.2% |
| Nigerians | 0.1 /100 | #274 | Tragic 43.2% |
| Immigrants | Bangladesh | 0.0 /100 | #275 | Tragic 43.1% |
| Immigrants | Ethiopia | 0.0 /100 | #276 | Tragic 43.1% |
| Immigrants | Eastern Africa | 0.0 /100 | #277 | Tragic 42.9% |
| Immigrants | Africa | 0.0 /100 | #278 | Tragic 42.9% |
| Sierra Leoneans | 0.0 /100 | #279 | Tragic 42.9% |
| Immigrants | Ecuador | 0.0 /100 | #280 | Tragic 42.9% |
Demographics Similar to Immigrants from Latvia by Married-couple Households
In terms of married-couple households, the demographic groups most similar to Immigrants from Latvia are Immigrants from Kuwait (46.0%, a difference of 0.060%), South American Indian (46.0%, a difference of 0.070%), Choctaw (46.0%, a difference of 0.10%), Fijian (46.1%, a difference of 0.11%), and Immigrants from Northern Africa (46.0%, a difference of 0.11%).
| Demographics | Rating | Rank | Married-couple Households |
| Yugoslavians | 38.9 /100 | #182 | Fair 46.2% |
| Immigrants | Brazil | 38.3 /100 | #183 | Fair 46.2% |
| Immigrants | Switzerland | 36.9 /100 | #184 | Fair 46.2% |
| Brazilians | 35.9 /100 | #185 | Fair 46.2% |
| Albanians | 31.1 /100 | #186 | Fair 46.1% |
| Fijians | 29.2 /100 | #187 | Fair 46.1% |
| South American Indians | 28.4 /100 | #188 | Fair 46.0% |
| Immigrants | Latvia | 26.9 /100 | #189 | Fair 46.0% |
| Immigrants | Kuwait | 25.6 /100 | #190 | Fair 46.0% |
| Choctaw | 24.9 /100 | #191 | Fair 46.0% |
| Immigrants | Northern Africa | 24.6 /100 | #192 | Fair 46.0% |
| Taiwanese | 23.4 /100 | #193 | Fair 45.9% |
| Mexican American Indians | 23.3 /100 | #194 | Fair 45.9% |
| Chickasaw | 22.7 /100 | #195 | Fair 45.9% |
| Immigrants | South America | 22.2 /100 | #196 | Fair 45.9% |