Thai vs Immigrants from Latvia Married-couple Households
COMPARE
Thai
Immigrants from Latvia
Married-couple Households
Married-couple Households Comparison
Thais
Immigrants from Latvia
51.9%
MARRIED-COUPLE HOUSEHOLDS
100.0/ 100
METRIC RATING
3rd/ 347
METRIC RANK
46.0%
MARRIED-COUPLE HOUSEHOLDS
26.9/ 100
METRIC RATING
189th/ 347
METRIC RANK
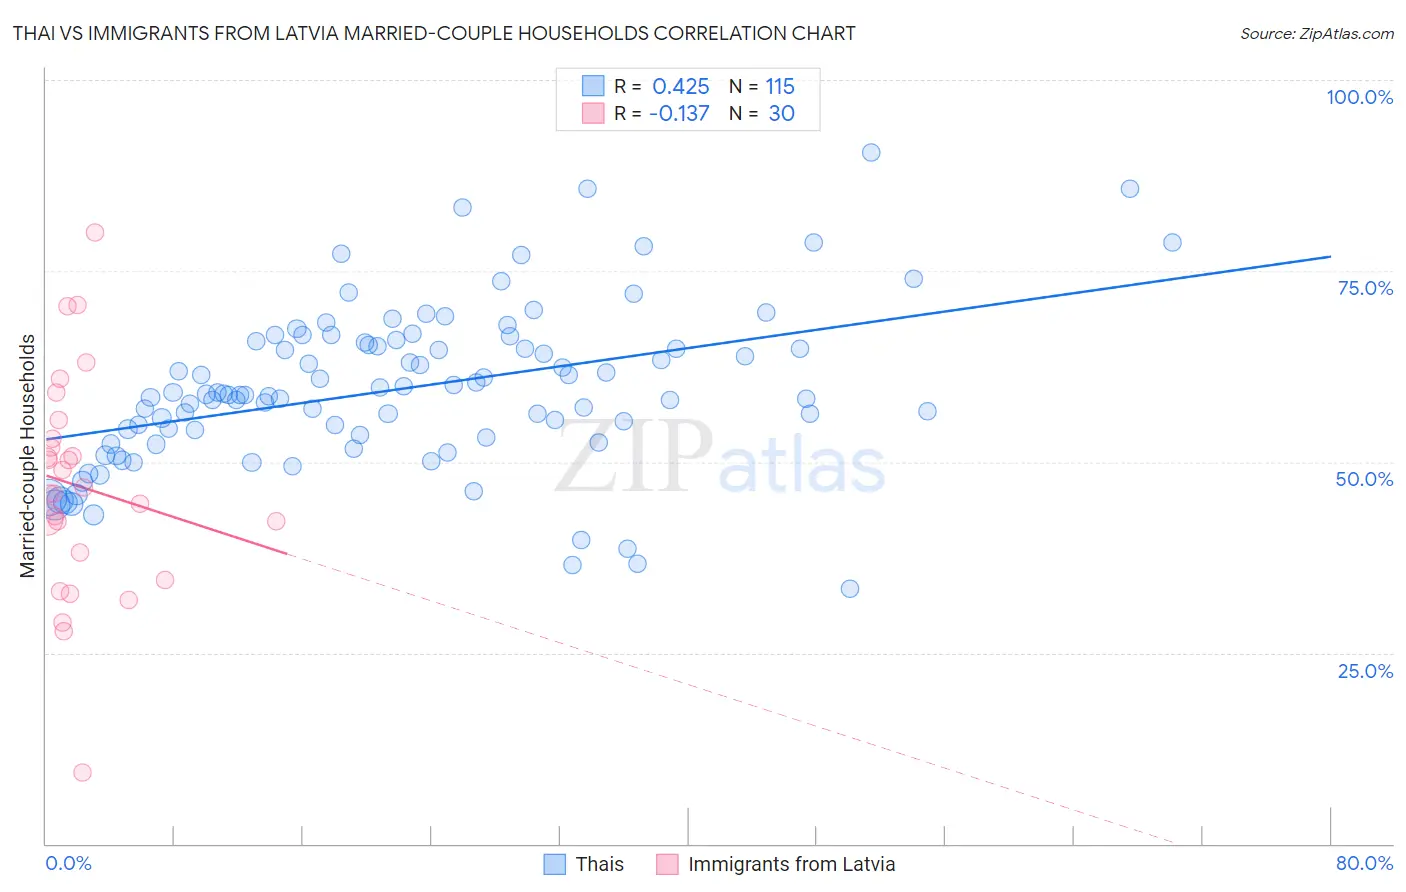
Thai vs Immigrants from Latvia Married-couple Households Correlation Chart
The statistical analysis conducted on geographies consisting of 475,348,785 people shows a moderate positive correlation between the proportion of Thais and percentage of married-couple family households in the United States with a correlation coefficient (R) of 0.425 and weighted average of 51.9%. Similarly, the statistical analysis conducted on geographies consisting of 113,732,502 people shows a poor negative correlation between the proportion of Immigrants from Latvia and percentage of married-couple family households in the United States with a correlation coefficient (R) of -0.137 and weighted average of 46.0%, a difference of 12.9%.
Married-couple Households Correlation Summary
| Measurement | Thai | Immigrants from Latvia |
| Minimum | 33.3% | 9.2% |
| Maximum | 90.5% | 80.0% |
| Range | 57.2% | 70.8% |
| Mean | 59.5% | 46.8% |
| Median | 58.8% | 46.2% |
| Interquartile 25% (IQ1) | 53.1% | 38.2% |
| Interquartile 75% (IQ3) | 65.6% | 53.0% |
| Interquartile Range (IQR) | 12.4% | 14.8% |
| Standard Deviation (Sample) | 10.5% | 14.4% |
| Standard Deviation (Population) | 10.5% | 14.2% |
Similar Demographics by Married-couple Households
Demographics Similar to Thais by Married-couple Households
In terms of married-couple households, the demographic groups most similar to Thais are Assyrian/Chaldean/Syriac (51.8%, a difference of 0.21%), Tongan (51.6%, a difference of 0.68%), Immigrants from Taiwan (52.4%, a difference of 0.97%), Immigrants from India (52.7%, a difference of 1.6%), and Danish (51.1%, a difference of 1.7%).
| Demographics | Rating | Rank | Married-couple Households |
| Immigrants | India | 100.0 /100 | #1 | Exceptional 52.7% |
| Immigrants | Taiwan | 100.0 /100 | #2 | Exceptional 52.4% |
| Thais | 100.0 /100 | #3 | Exceptional 51.9% |
| Assyrians/Chaldeans/Syriacs | 100.0 /100 | #4 | Exceptional 51.8% |
| Tongans | 100.0 /100 | #5 | Exceptional 51.6% |
| Danes | 100.0 /100 | #6 | Exceptional 51.1% |
| Filipinos | 100.0 /100 | #7 | Exceptional 51.0% |
| Immigrants | South Central Asia | 100.0 /100 | #8 | Exceptional 50.6% |
| Pennsylvania Germans | 100.0 /100 | #9 | Exceptional 50.4% |
| Chinese | 100.0 /100 | #10 | Exceptional 50.4% |
| Immigrants | Pakistan | 100.0 /100 | #11 | Exceptional 50.1% |
| Swiss | 100.0 /100 | #12 | Exceptional 49.9% |
| Immigrants | Korea | 100.0 /100 | #13 | Exceptional 49.9% |
| Burmese | 100.0 /100 | #14 | Exceptional 49.8% |
| Koreans | 99.9 /100 | #15 | Exceptional 49.7% |
Demographics Similar to Immigrants from Latvia by Married-couple Households
In terms of married-couple households, the demographic groups most similar to Immigrants from Latvia are Immigrants from Kuwait (46.0%, a difference of 0.060%), South American Indian (46.0%, a difference of 0.070%), Choctaw (46.0%, a difference of 0.10%), Fijian (46.1%, a difference of 0.11%), and Immigrants from Northern Africa (46.0%, a difference of 0.11%).
| Demographics | Rating | Rank | Married-couple Households |
| Yugoslavians | 38.9 /100 | #182 | Fair 46.2% |
| Immigrants | Brazil | 38.3 /100 | #183 | Fair 46.2% |
| Immigrants | Switzerland | 36.9 /100 | #184 | Fair 46.2% |
| Brazilians | 35.9 /100 | #185 | Fair 46.2% |
| Albanians | 31.1 /100 | #186 | Fair 46.1% |
| Fijians | 29.2 /100 | #187 | Fair 46.1% |
| South American Indians | 28.4 /100 | #188 | Fair 46.0% |
| Immigrants | Latvia | 26.9 /100 | #189 | Fair 46.0% |
| Immigrants | Kuwait | 25.6 /100 | #190 | Fair 46.0% |
| Choctaw | 24.9 /100 | #191 | Fair 46.0% |
| Immigrants | Northern Africa | 24.6 /100 | #192 | Fair 46.0% |
| Taiwanese | 23.4 /100 | #193 | Fair 45.9% |
| Mexican American Indians | 23.3 /100 | #194 | Fair 45.9% |
| Chickasaw | 22.7 /100 | #195 | Fair 45.9% |
| Immigrants | South America | 22.2 /100 | #196 | Fair 45.9% |