Immigrants from Trinidad and Tobago vs Lithuanian Married-couple Households
COMPARE
Immigrants from Trinidad and Tobago
Lithuanian
Married-couple Households
Married-couple Households Comparison
Immigrants from Trinidad and Tobago
Lithuanians
41.2%
MARRIED-COUPLE HOUSEHOLDS
0.0/ 100
METRIC RATING
309th/ 347
METRIC RANK
48.9%
MARRIED-COUPLE HOUSEHOLDS
99.6/ 100
METRIC RATING
39th/ 347
METRIC RANK
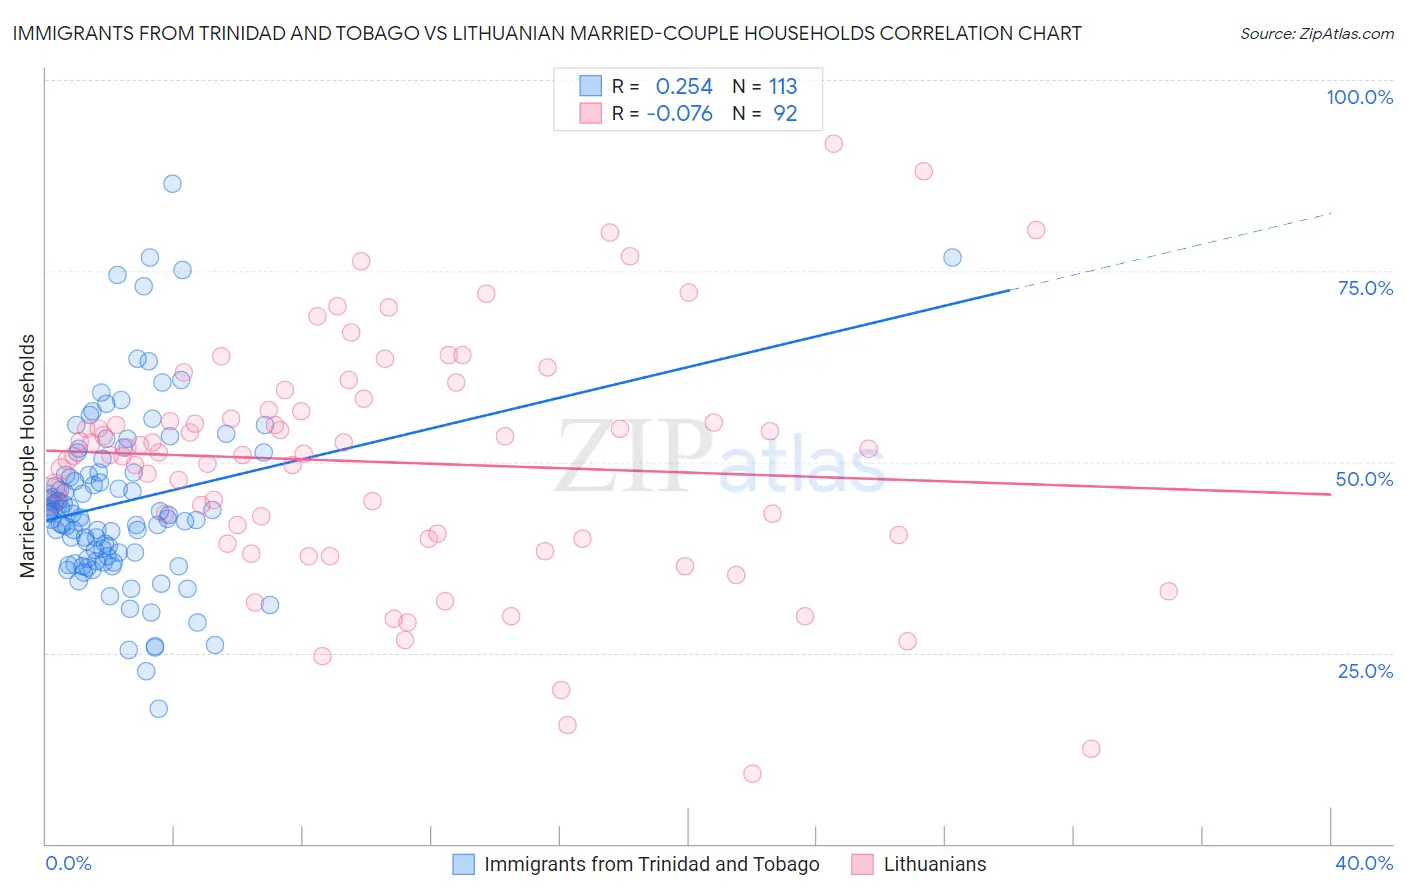
Immigrants from Trinidad and Tobago vs Lithuanian Married-couple Households Correlation Chart
The statistical analysis conducted on geographies consisting of 223,481,382 people shows a weak positive correlation between the proportion of Immigrants from Trinidad and Tobago and percentage of married-couple family households in the United States with a correlation coefficient (R) of 0.254 and weighted average of 41.2%. Similarly, the statistical analysis conducted on geographies consisting of 421,720,983 people shows a slight negative correlation between the proportion of Lithuanians and percentage of married-couple family households in the United States with a correlation coefficient (R) of -0.076 and weighted average of 48.9%, a difference of 18.6%.
Married-couple Households Correlation Summary
| Measurement | Immigrants from Trinidad and Tobago | Lithuanian |
| Minimum | 17.7% | 9.2% |
| Maximum | 86.4% | 91.7% |
| Range | 68.7% | 82.5% |
| Mean | 44.7% | 49.9% |
| Median | 43.2% | 51.1% |
| Interquartile 25% (IQ1) | 37.5% | 40.2% |
| Interquartile 75% (IQ3) | 48.6% | 56.7% |
| Interquartile Range (IQR) | 11.2% | 16.5% |
| Standard Deviation (Sample) | 11.5% | 15.6% |
| Standard Deviation (Population) | 11.5% | 15.5% |
Similar Demographics by Married-couple Households
Demographics Similar to Immigrants from Trinidad and Tobago by Married-couple Households
In terms of married-couple households, the demographic groups most similar to Immigrants from Trinidad and Tobago are Haitian (41.2%, a difference of 0.070%), Crow (41.4%, a difference of 0.35%), Guyanese (41.4%, a difference of 0.36%), Immigrants from Western Africa (41.4%, a difference of 0.36%), and Colville (41.0%, a difference of 0.57%).
| Demographics | Rating | Rank | Married-couple Households |
| Immigrants | Honduras | 0.0 /100 | #302 | Tragic 41.6% |
| Sub-Saharan Africans | 0.0 /100 | #303 | Tragic 41.6% |
| Immigrants | Guyana | 0.0 /100 | #304 | Tragic 41.6% |
| Sioux | 0.0 /100 | #305 | Tragic 41.5% |
| Guyanese | 0.0 /100 | #306 | Tragic 41.4% |
| Immigrants | Western Africa | 0.0 /100 | #307 | Tragic 41.4% |
| Crow | 0.0 /100 | #308 | Tragic 41.4% |
| Immigrants | Trinidad and Tobago | 0.0 /100 | #309 | Tragic 41.2% |
| Haitians | 0.0 /100 | #310 | Tragic 41.2% |
| Colville | 0.0 /100 | #311 | Tragic 41.0% |
| Africans | 0.0 /100 | #312 | Tragic 40.9% |
| Immigrants | Haiti | 0.0 /100 | #313 | Tragic 40.9% |
| Jamaicans | 0.0 /100 | #314 | Tragic 40.9% |
| Trinidadians and Tobagonians | 0.0 /100 | #315 | Tragic 40.9% |
| Immigrants | Caribbean | 0.0 /100 | #316 | Tragic 40.8% |
Demographics Similar to Lithuanians by Married-couple Households
In terms of married-couple households, the demographic groups most similar to Lithuanians are Immigrants from Bolivia (48.9%, a difference of 0.010%), Immigrants from Lebanon (48.9%, a difference of 0.050%), Greek (48.9%, a difference of 0.080%), Immigrants from Vietnam (48.8%, a difference of 0.090%), and Immigrants from Iran (48.8%, a difference of 0.15%).
| Demographics | Rating | Rank | Married-couple Households |
| Hungarians | 99.8 /100 | #32 | Exceptional 49.1% |
| Immigrants | Asia | 99.7 /100 | #33 | Exceptional 49.1% |
| Italians | 99.7 /100 | #34 | Exceptional 49.0% |
| Scottish | 99.7 /100 | #35 | Exceptional 49.0% |
| Iranians | 99.7 /100 | #36 | Exceptional 49.0% |
| Sri Lankans | 99.7 /100 | #37 | Exceptional 49.0% |
| Greeks | 99.7 /100 | #38 | Exceptional 48.9% |
| Lithuanians | 99.6 /100 | #39 | Exceptional 48.9% |
| Immigrants | Bolivia | 99.6 /100 | #40 | Exceptional 48.9% |
| Immigrants | Lebanon | 99.6 /100 | #41 | Exceptional 48.9% |
| Immigrants | Vietnam | 99.6 /100 | #42 | Exceptional 48.8% |
| Immigrants | Iran | 99.6 /100 | #43 | Exceptional 48.8% |
| Welsh | 99.5 /100 | #44 | Exceptional 48.8% |
| Immigrants | Eastern Asia | 99.5 /100 | #45 | Exceptional 48.8% |
| Tsimshian | 99.5 /100 | #46 | Exceptional 48.7% |