Cuban vs Immigrants from Latvia Married-couple Households
COMPARE
Cuban
Immigrants from Latvia
Married-couple Households
Married-couple Households Comparison
Cubans
Immigrants from Latvia
45.4%
MARRIED-COUPLE HOUSEHOLDS
7.7/ 100
METRIC RATING
210th/ 347
METRIC RANK
46.0%
MARRIED-COUPLE HOUSEHOLDS
26.9/ 100
METRIC RATING
189th/ 347
METRIC RANK
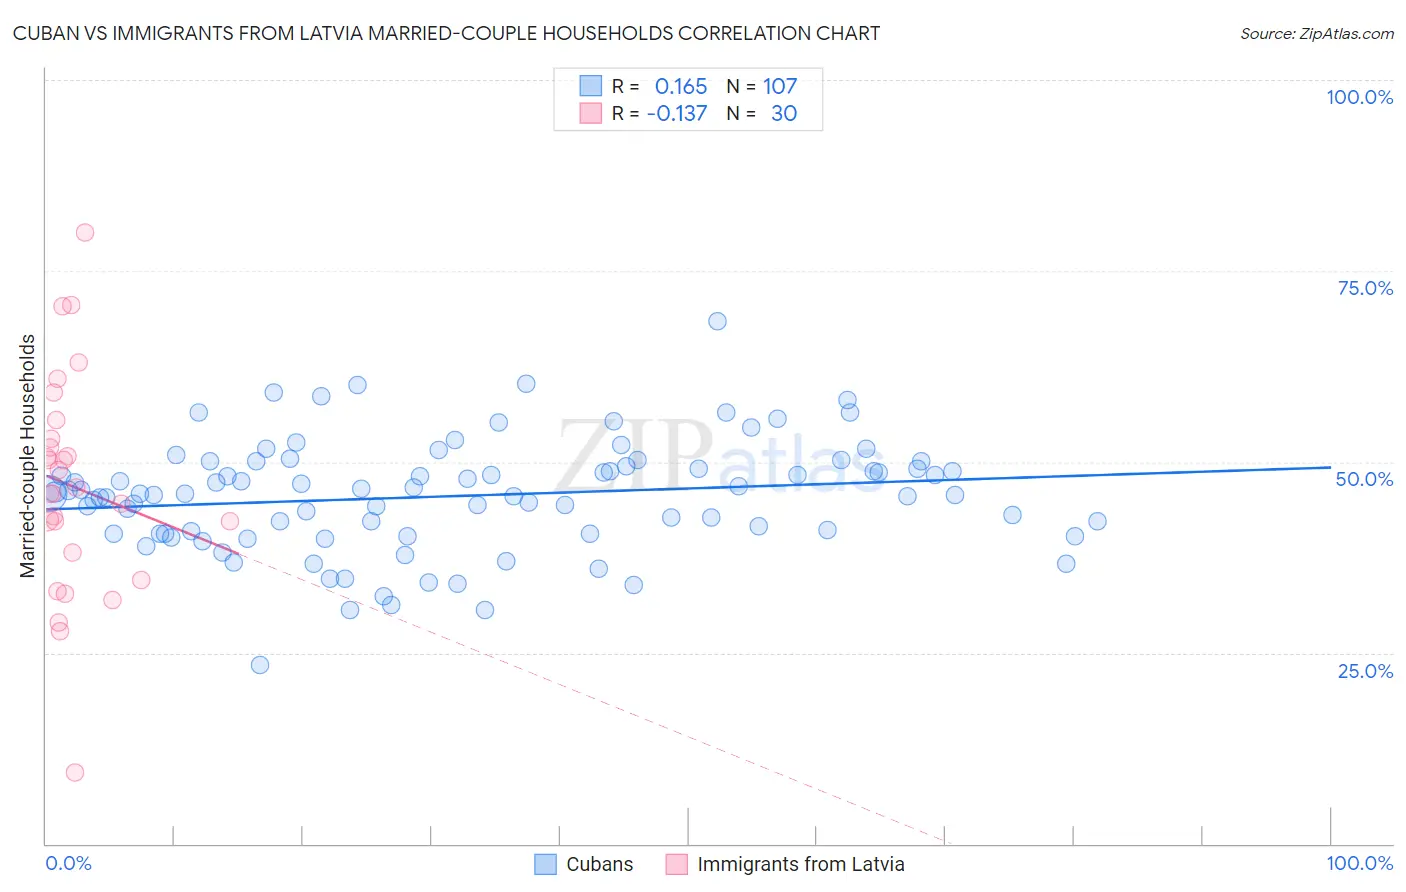
Cuban vs Immigrants from Latvia Married-couple Households Correlation Chart
The statistical analysis conducted on geographies consisting of 448,946,522 people shows a poor positive correlation between the proportion of Cubans and percentage of married-couple family households in the United States with a correlation coefficient (R) of 0.165 and weighted average of 45.4%. Similarly, the statistical analysis conducted on geographies consisting of 113,732,502 people shows a poor negative correlation between the proportion of Immigrants from Latvia and percentage of married-couple family households in the United States with a correlation coefficient (R) of -0.137 and weighted average of 46.0%, a difference of 1.4%.
Married-couple Households Correlation Summary
| Measurement | Cuban | Immigrants from Latvia |
| Minimum | 23.5% | 9.2% |
| Maximum | 68.4% | 80.0% |
| Range | 45.0% | 70.8% |
| Mean | 45.5% | 46.8% |
| Median | 45.8% | 46.2% |
| Interquartile 25% (IQ1) | 40.6% | 38.2% |
| Interquartile 75% (IQ3) | 49.4% | 53.0% |
| Interquartile Range (IQR) | 8.8% | 14.8% |
| Standard Deviation (Sample) | 7.3% | 14.4% |
| Standard Deviation (Population) | 7.3% | 14.2% |
Similar Demographics by Married-couple Households
Demographics Similar to Cubans by Married-couple Households
In terms of married-couple households, the demographic groups most similar to Cubans are Immigrants from Spain (45.3%, a difference of 0.050%), Immigrants from Uzbekistan (45.4%, a difference of 0.090%), Hispanic or Latino (45.4%, a difference of 0.13%), Immigrants from France (45.4%, a difference of 0.14%), and Creek (45.3%, a difference of 0.18%).
| Demographics | Rating | Rank | Married-couple Households |
| Alaska Natives | 13.0 /100 | #203 | Poor 45.6% |
| Aleuts | 12.5 /100 | #204 | Poor 45.6% |
| Nepalese | 11.9 /100 | #205 | Poor 45.6% |
| Uruguayans | 10.4 /100 | #206 | Poor 45.5% |
| Immigrants | France | 8.8 /100 | #207 | Tragic 45.4% |
| Hispanics or Latinos | 8.7 /100 | #208 | Tragic 45.4% |
| Immigrants | Uzbekistan | 8.4 /100 | #209 | Tragic 45.4% |
| Cubans | 7.7 /100 | #210 | Tragic 45.4% |
| Immigrants | Spain | 7.3 /100 | #211 | Tragic 45.3% |
| Creek | 6.4 /100 | #212 | Tragic 45.3% |
| Yakama | 5.8 /100 | #213 | Tragic 45.2% |
| Japanese | 5.7 /100 | #214 | Tragic 45.2% |
| Immigrants | Nepal | 5.6 /100 | #215 | Tragic 45.2% |
| Immigrants | Portugal | 5.6 /100 | #216 | Tragic 45.2% |
| Panamanians | 5.5 /100 | #217 | Tragic 45.2% |
Demographics Similar to Immigrants from Latvia by Married-couple Households
In terms of married-couple households, the demographic groups most similar to Immigrants from Latvia are Immigrants from Kuwait (46.0%, a difference of 0.060%), South American Indian (46.0%, a difference of 0.070%), Choctaw (46.0%, a difference of 0.10%), Fijian (46.1%, a difference of 0.11%), and Immigrants from Northern Africa (46.0%, a difference of 0.11%).
| Demographics | Rating | Rank | Married-couple Households |
| Yugoslavians | 38.9 /100 | #182 | Fair 46.2% |
| Immigrants | Brazil | 38.3 /100 | #183 | Fair 46.2% |
| Immigrants | Switzerland | 36.9 /100 | #184 | Fair 46.2% |
| Brazilians | 35.9 /100 | #185 | Fair 46.2% |
| Albanians | 31.1 /100 | #186 | Fair 46.1% |
| Fijians | 29.2 /100 | #187 | Fair 46.1% |
| South American Indians | 28.4 /100 | #188 | Fair 46.0% |
| Immigrants | Latvia | 26.9 /100 | #189 | Fair 46.0% |
| Immigrants | Kuwait | 25.6 /100 | #190 | Fair 46.0% |
| Choctaw | 24.9 /100 | #191 | Fair 46.0% |
| Immigrants | Northern Africa | 24.6 /100 | #192 | Fair 46.0% |
| Taiwanese | 23.4 /100 | #193 | Fair 45.9% |
| Mexican American Indians | 23.3 /100 | #194 | Fair 45.9% |
| Chickasaw | 22.7 /100 | #195 | Fair 45.9% |
| Immigrants | South America | 22.2 /100 | #196 | Fair 45.9% |