Albanian vs Immigrants from Eritrea Married-couple Households
COMPARE
Albanian
Immigrants from Eritrea
Married-couple Households
Married-couple Households Comparison
Albanians
Immigrants from Eritrea
46.1%
MARRIED-COUPLE HOUSEHOLDS
31.1/ 100
METRIC RATING
186th/ 347
METRIC RANK
42.1%
MARRIED-COUPLE HOUSEHOLDS
0.0/ 100
METRIC RATING
288th/ 347
METRIC RANK
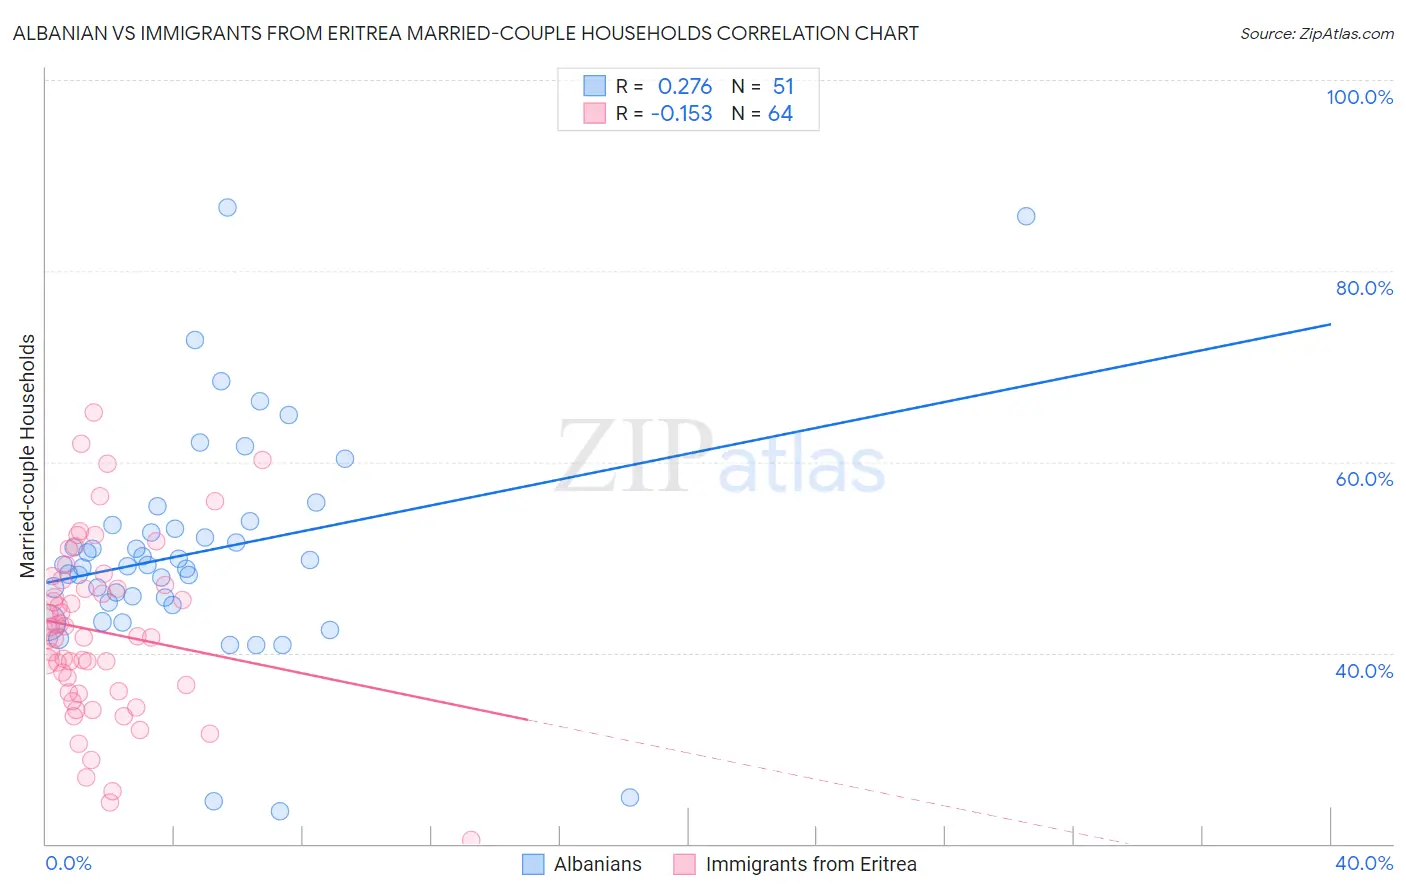
Albanian vs Immigrants from Eritrea Married-couple Households Correlation Chart
The statistical analysis conducted on geographies consisting of 193,184,861 people shows a weak positive correlation between the proportion of Albanians and percentage of married-couple family households in the United States with a correlation coefficient (R) of 0.276 and weighted average of 46.1%. Similarly, the statistical analysis conducted on geographies consisting of 104,844,596 people shows a poor negative correlation between the proportion of Immigrants from Eritrea and percentage of married-couple family households in the United States with a correlation coefficient (R) of -0.153 and weighted average of 42.1%, a difference of 9.5%.
Married-couple Households Correlation Summary
| Measurement | Albanian | Immigrants from Eritrea |
| Minimum | 23.4% | 20.5% |
| Maximum | 86.6% | 65.2% |
| Range | 63.2% | 44.8% |
| Mean | 50.5% | 42.2% |
| Median | 49.1% | 41.7% |
| Interquartile 25% (IQ1) | 45.2% | 35.9% |
| Interquartile 75% (IQ3) | 53.3% | 47.4% |
| Interquartile Range (IQR) | 8.1% | 11.5% |
| Standard Deviation (Sample) | 11.9% | 9.2% |
| Standard Deviation (Population) | 11.8% | 9.1% |
Similar Demographics by Married-couple Households
Demographics Similar to Albanians by Married-couple Households
In terms of married-couple households, the demographic groups most similar to Albanians are Fijian (46.1%, a difference of 0.080%), South American Indian (46.0%, a difference of 0.13%), Brazilian (46.2%, a difference of 0.20%), Immigrants from Latvia (46.0%, a difference of 0.20%), and Immigrants from Switzerland (46.2%, a difference of 0.24%).
| Demographics | Rating | Rank | Married-couple Households |
| Immigrants | Zimbabwe | 43.0 /100 | #179 | Average 46.3% |
| Mongolians | 42.0 /100 | #180 | Average 46.3% |
| Malaysians | 41.8 /100 | #181 | Average 46.3% |
| Yugoslavians | 38.9 /100 | #182 | Fair 46.2% |
| Immigrants | Brazil | 38.3 /100 | #183 | Fair 46.2% |
| Immigrants | Switzerland | 36.9 /100 | #184 | Fair 46.2% |
| Brazilians | 35.9 /100 | #185 | Fair 46.2% |
| Albanians | 31.1 /100 | #186 | Fair 46.1% |
| Fijians | 29.2 /100 | #187 | Fair 46.1% |
| South American Indians | 28.4 /100 | #188 | Fair 46.0% |
| Immigrants | Latvia | 26.9 /100 | #189 | Fair 46.0% |
| Immigrants | Kuwait | 25.6 /100 | #190 | Fair 46.0% |
| Choctaw | 24.9 /100 | #191 | Fair 46.0% |
| Immigrants | Northern Africa | 24.6 /100 | #192 | Fair 46.0% |
| Taiwanese | 23.4 /100 | #193 | Fair 45.9% |
Demographics Similar to Immigrants from Eritrea by Married-couple Households
In terms of married-couple households, the demographic groups most similar to Immigrants from Eritrea are Sudanese (42.1%, a difference of 0.060%), Chippewa (42.1%, a difference of 0.080%), Honduran (42.1%, a difference of 0.11%), Paiute (42.1%, a difference of 0.11%), and Indonesian (42.0%, a difference of 0.16%).
| Demographics | Rating | Rank | Married-couple Households |
| Immigrants | Guatemala | 0.0 /100 | #281 | Tragic 42.8% |
| Bermudans | 0.0 /100 | #282 | Tragic 42.4% |
| Inupiat | 0.0 /100 | #283 | Tragic 42.4% |
| Cheyenne | 0.0 /100 | #284 | Tragic 42.3% |
| Ghanaians | 0.0 /100 | #285 | Tragic 42.2% |
| Belizeans | 0.0 /100 | #286 | Tragic 42.2% |
| Chippewa | 0.0 /100 | #287 | Tragic 42.1% |
| Immigrants | Eritrea | 0.0 /100 | #288 | Tragic 42.1% |
| Sudanese | 0.0 /100 | #289 | Tragic 42.1% |
| Hondurans | 0.0 /100 | #290 | Tragic 42.1% |
| Paiute | 0.0 /100 | #291 | Tragic 42.1% |
| Indonesians | 0.0 /100 | #292 | Tragic 42.0% |
| Menominee | 0.0 /100 | #293 | Tragic 42.0% |
| Immigrants | Yemen | 0.0 /100 | #294 | Tragic 42.0% |
| Kiowa | 0.0 /100 | #295 | Tragic 42.0% |