Immigrants from Dominica vs Immigrants from Eritrea Married-couple Households
COMPARE
Immigrants from Dominica
Immigrants from Eritrea
Married-couple Households
Married-couple Households Comparison
Immigrants from Dominica
Immigrants from Eritrea
39.4%
MARRIED-COUPLE HOUSEHOLDS
0.0/ 100
METRIC RATING
329th/ 347
METRIC RANK
42.1%
MARRIED-COUPLE HOUSEHOLDS
0.0/ 100
METRIC RATING
288th/ 347
METRIC RANK
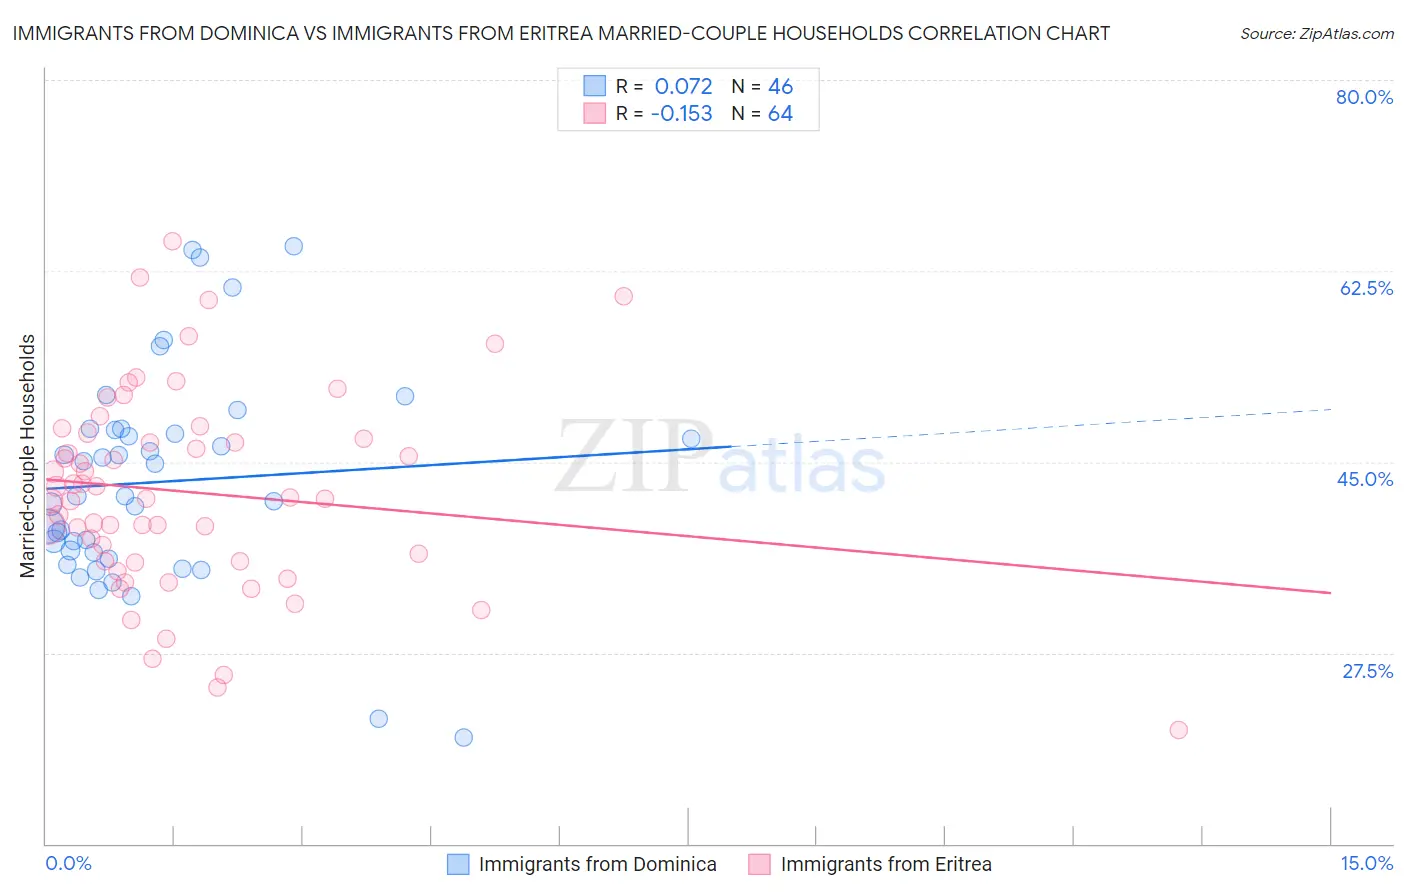
Immigrants from Dominica vs Immigrants from Eritrea Married-couple Households Correlation Chart
The statistical analysis conducted on geographies consisting of 83,789,752 people shows a slight positive correlation between the proportion of Immigrants from Dominica and percentage of married-couple family households in the United States with a correlation coefficient (R) of 0.072 and weighted average of 39.4%. Similarly, the statistical analysis conducted on geographies consisting of 104,844,596 people shows a poor negative correlation between the proportion of Immigrants from Eritrea and percentage of married-couple family households in the United States with a correlation coefficient (R) of -0.153 and weighted average of 42.1%, a difference of 6.9%.
Married-couple Households Correlation Summary
| Measurement | Immigrants from Dominica | Immigrants from Eritrea |
| Minimum | 19.7% | 20.5% |
| Maximum | 64.7% | 65.2% |
| Range | 45.0% | 44.8% |
| Mean | 43.2% | 42.2% |
| Median | 41.9% | 41.7% |
| Interquartile 25% (IQ1) | 36.7% | 35.9% |
| Interquartile 75% (IQ3) | 48.0% | 47.4% |
| Interquartile Range (IQR) | 11.2% | 11.5% |
| Standard Deviation (Sample) | 9.7% | 9.2% |
| Standard Deviation (Population) | 9.6% | 9.1% |
Similar Demographics by Married-couple Households
Demographics Similar to Immigrants from Dominica by Married-couple Households
In terms of married-couple households, the demographic groups most similar to Immigrants from Dominica are Barbadian (39.4%, a difference of 0.080%), Immigrants from Barbados (39.2%, a difference of 0.44%), Lumbee (39.6%, a difference of 0.57%), Immigrants from Congo (39.0%, a difference of 0.88%), and Somali (39.0%, a difference of 0.96%).
| Demographics | Rating | Rank | Married-couple Households |
| Immigrants | Zaire | 0.0 /100 | #322 | Tragic 40.1% |
| Puerto Ricans | 0.0 /100 | #323 | Tragic 40.1% |
| Navajo | 0.0 /100 | #324 | Tragic 40.1% |
| Pueblo | 0.0 /100 | #325 | Tragic 40.0% |
| U.S. Virgin Islanders | 0.0 /100 | #326 | Tragic 39.8% |
| Lumbee | 0.0 /100 | #327 | Tragic 39.6% |
| Barbadians | 0.0 /100 | #328 | Tragic 39.4% |
| Immigrants | Dominica | 0.0 /100 | #329 | Tragic 39.4% |
| Immigrants | Barbados | 0.0 /100 | #330 | Tragic 39.2% |
| Immigrants | Congo | 0.0 /100 | #331 | Tragic 39.0% |
| Somalis | 0.0 /100 | #332 | Tragic 39.0% |
| Immigrants | West Indies | 0.0 /100 | #333 | Tragic 39.0% |
| Immigrants | St. Vincent and the Grenadines | 0.0 /100 | #334 | Tragic 38.7% |
| Senegalese | 0.0 /100 | #335 | Tragic 38.6% |
| Blacks/African Americans | 0.0 /100 | #336 | Tragic 38.5% |
Demographics Similar to Immigrants from Eritrea by Married-couple Households
In terms of married-couple households, the demographic groups most similar to Immigrants from Eritrea are Sudanese (42.1%, a difference of 0.060%), Chippewa (42.1%, a difference of 0.080%), Honduran (42.1%, a difference of 0.11%), Paiute (42.1%, a difference of 0.11%), and Indonesian (42.0%, a difference of 0.16%).
| Demographics | Rating | Rank | Married-couple Households |
| Immigrants | Guatemala | 0.0 /100 | #281 | Tragic 42.8% |
| Bermudans | 0.0 /100 | #282 | Tragic 42.4% |
| Inupiat | 0.0 /100 | #283 | Tragic 42.4% |
| Cheyenne | 0.0 /100 | #284 | Tragic 42.3% |
| Ghanaians | 0.0 /100 | #285 | Tragic 42.2% |
| Belizeans | 0.0 /100 | #286 | Tragic 42.2% |
| Chippewa | 0.0 /100 | #287 | Tragic 42.1% |
| Immigrants | Eritrea | 0.0 /100 | #288 | Tragic 42.1% |
| Sudanese | 0.0 /100 | #289 | Tragic 42.1% |
| Hondurans | 0.0 /100 | #290 | Tragic 42.1% |
| Paiute | 0.0 /100 | #291 | Tragic 42.1% |
| Indonesians | 0.0 /100 | #292 | Tragic 42.0% |
| Menominee | 0.0 /100 | #293 | Tragic 42.0% |
| Immigrants | Yemen | 0.0 /100 | #294 | Tragic 42.0% |
| Kiowa | 0.0 /100 | #295 | Tragic 42.0% |