Spanish American vs Immigrants from Eritrea Married-couple Households
COMPARE
Spanish American
Immigrants from Eritrea
Married-couple Households
Married-couple Households Comparison
Spanish Americans
Immigrants from Eritrea
44.5%
MARRIED-COUPLE HOUSEHOLDS
1.1/ 100
METRIC RATING
239th/ 347
METRIC RANK
42.1%
MARRIED-COUPLE HOUSEHOLDS
0.0/ 100
METRIC RATING
288th/ 347
METRIC RANK
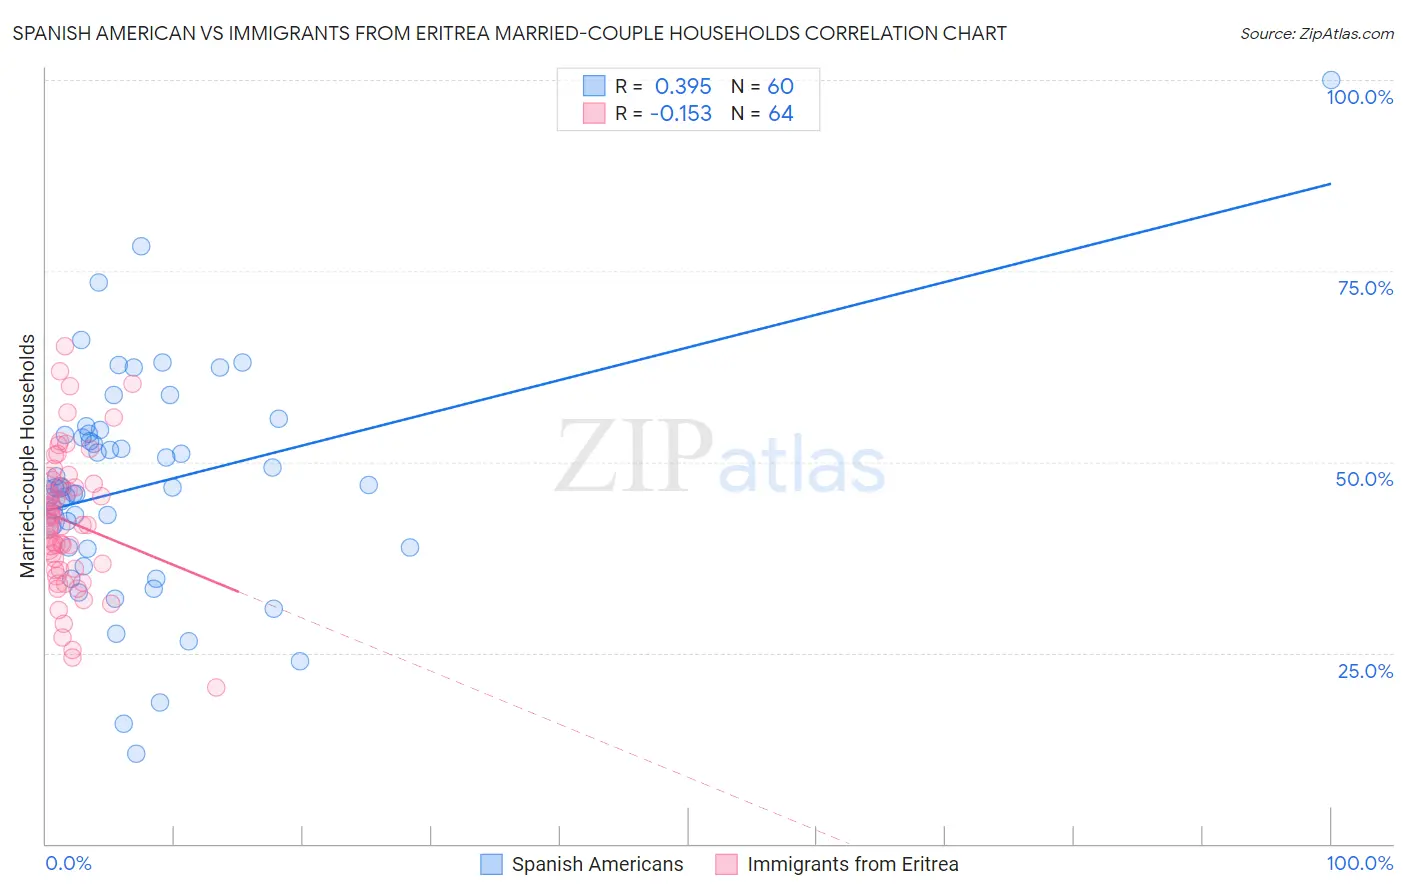
Spanish American vs Immigrants from Eritrea Married-couple Households Correlation Chart
The statistical analysis conducted on geographies consisting of 103,168,336 people shows a mild positive correlation between the proportion of Spanish Americans and percentage of married-couple family households in the United States with a correlation coefficient (R) of 0.395 and weighted average of 44.5%. Similarly, the statistical analysis conducted on geographies consisting of 104,844,596 people shows a poor negative correlation between the proportion of Immigrants from Eritrea and percentage of married-couple family households in the United States with a correlation coefficient (R) of -0.153 and weighted average of 42.1%, a difference of 5.6%.
Married-couple Households Correlation Summary
| Measurement | Spanish American | Immigrants from Eritrea |
| Minimum | 11.8% | 20.5% |
| Maximum | 100.0% | 65.2% |
| Range | 88.2% | 44.8% |
| Mean | 46.9% | 42.2% |
| Median | 46.6% | 41.7% |
| Interquartile 25% (IQ1) | 38.8% | 35.9% |
| Interquartile 75% (IQ3) | 53.6% | 47.4% |
| Interquartile Range (IQR) | 14.9% | 11.5% |
| Standard Deviation (Sample) | 14.7% | 9.2% |
| Standard Deviation (Population) | 14.6% | 9.1% |
Similar Demographics by Married-couple Households
Demographics Similar to Spanish Americans by Married-couple Households
In terms of married-couple households, the demographic groups most similar to Spanish Americans are Immigrants from Uruguay (44.5%, a difference of 0.020%), Comanche (44.5%, a difference of 0.070%), Ute (44.4%, a difference of 0.080%), Immigrants from Bosnia and Herzegovina (44.4%, a difference of 0.080%), and Immigrants from Nicaragua (44.5%, a difference of 0.10%).
| Demographics | Rating | Rank | Married-couple Households |
| Marshallese | 1.5 /100 | #232 | Tragic 44.6% |
| Immigrants | Uganda | 1.5 /100 | #233 | Tragic 44.6% |
| Immigrants | Panama | 1.3 /100 | #234 | Tragic 44.6% |
| Immigrants | Nicaragua | 1.2 /100 | #235 | Tragic 44.5% |
| Yaqui | 1.2 /100 | #236 | Tragic 44.5% |
| Comanche | 1.2 /100 | #237 | Tragic 44.5% |
| Immigrants | Uruguay | 1.1 /100 | #238 | Tragic 44.5% |
| Spanish Americans | 1.1 /100 | #239 | Tragic 44.5% |
| Ute | 1.0 /100 | #240 | Tragic 44.4% |
| Immigrants | Bosnia and Herzegovina | 1.0 /100 | #241 | Tragic 44.4% |
| Immigrants | Albania | 1.0 /100 | #242 | Tragic 44.4% |
| Immigrants | Saudi Arabia | 0.9 /100 | #243 | Tragic 44.4% |
| Immigrants | Armenia | 0.7 /100 | #244 | Tragic 44.3% |
| Immigrants | El Salvador | 0.7 /100 | #245 | Tragic 44.3% |
| Immigrants | Cuba | 0.6 /100 | #246 | Tragic 44.2% |
Demographics Similar to Immigrants from Eritrea by Married-couple Households
In terms of married-couple households, the demographic groups most similar to Immigrants from Eritrea are Sudanese (42.1%, a difference of 0.060%), Chippewa (42.1%, a difference of 0.080%), Honduran (42.1%, a difference of 0.11%), Paiute (42.1%, a difference of 0.11%), and Indonesian (42.0%, a difference of 0.16%).
| Demographics | Rating | Rank | Married-couple Households |
| Immigrants | Guatemala | 0.0 /100 | #281 | Tragic 42.8% |
| Bermudans | 0.0 /100 | #282 | Tragic 42.4% |
| Inupiat | 0.0 /100 | #283 | Tragic 42.4% |
| Cheyenne | 0.0 /100 | #284 | Tragic 42.3% |
| Ghanaians | 0.0 /100 | #285 | Tragic 42.2% |
| Belizeans | 0.0 /100 | #286 | Tragic 42.2% |
| Chippewa | 0.0 /100 | #287 | Tragic 42.1% |
| Immigrants | Eritrea | 0.0 /100 | #288 | Tragic 42.1% |
| Sudanese | 0.0 /100 | #289 | Tragic 42.1% |
| Hondurans | 0.0 /100 | #290 | Tragic 42.1% |
| Paiute | 0.0 /100 | #291 | Tragic 42.1% |
| Indonesians | 0.0 /100 | #292 | Tragic 42.0% |
| Menominee | 0.0 /100 | #293 | Tragic 42.0% |
| Immigrants | Yemen | 0.0 /100 | #294 | Tragic 42.0% |
| Kiowa | 0.0 /100 | #295 | Tragic 42.0% |