Belgian vs Immigrants from Eritrea Married-couple Households
COMPARE
Belgian
Immigrants from Eritrea
Married-couple Households
Married-couple Households Comparison
Belgians
Immigrants from Eritrea
48.0%
MARRIED-COUPLE HOUSEHOLDS
97.4/ 100
METRIC RATING
86th/ 347
METRIC RANK
42.1%
MARRIED-COUPLE HOUSEHOLDS
0.0/ 100
METRIC RATING
288th/ 347
METRIC RANK
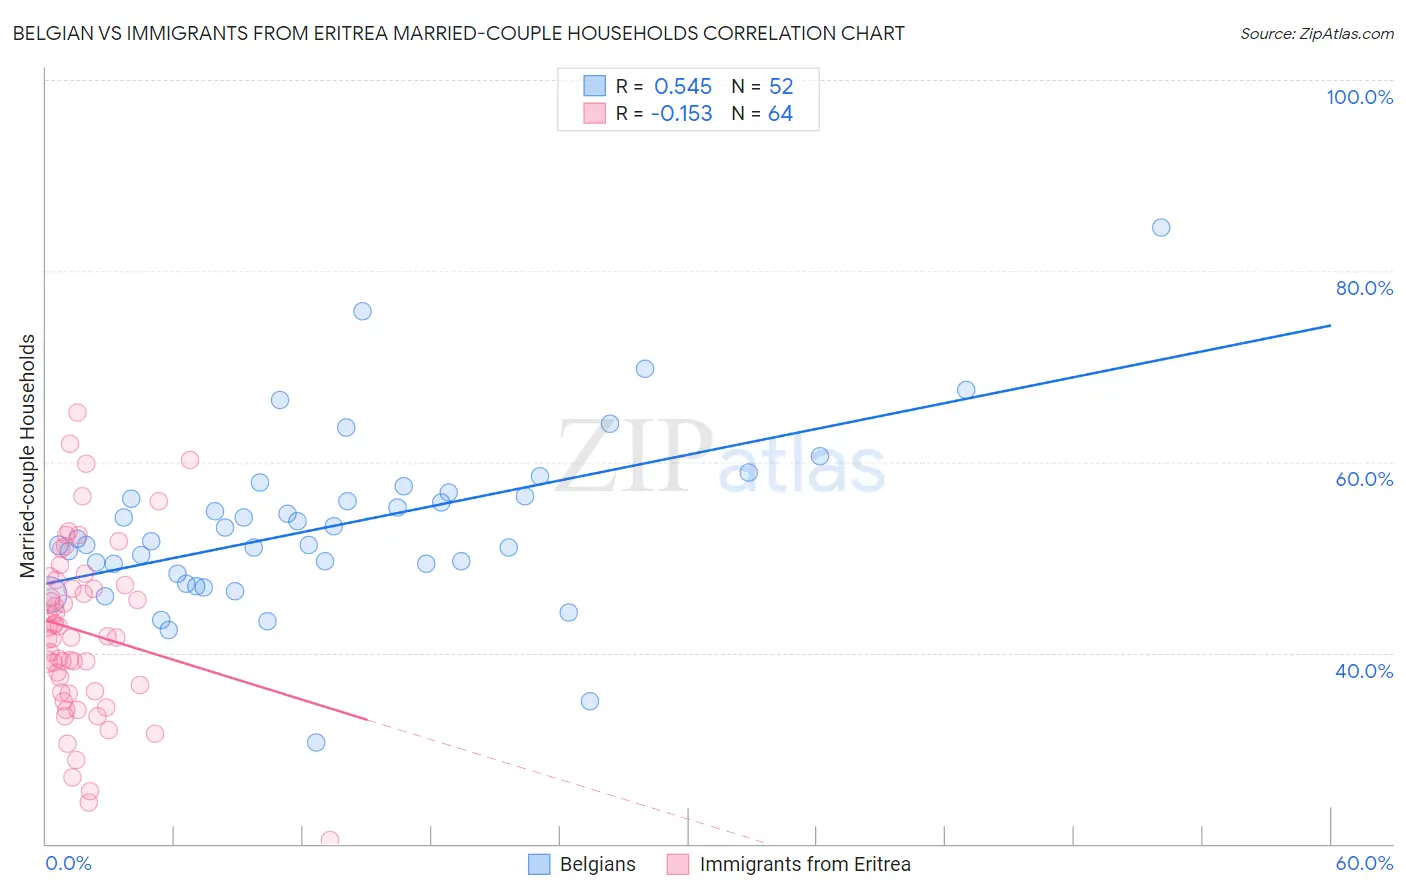
Belgian vs Immigrants from Eritrea Married-couple Households Correlation Chart
The statistical analysis conducted on geographies consisting of 355,838,514 people shows a substantial positive correlation between the proportion of Belgians and percentage of married-couple family households in the United States with a correlation coefficient (R) of 0.545 and weighted average of 48.0%. Similarly, the statistical analysis conducted on geographies consisting of 104,844,596 people shows a poor negative correlation between the proportion of Immigrants from Eritrea and percentage of married-couple family households in the United States with a correlation coefficient (R) of -0.153 and weighted average of 42.1%, a difference of 14.1%.
Married-couple Households Correlation Summary
| Measurement | Belgian | Immigrants from Eritrea |
| Minimum | 30.6% | 20.5% |
| Maximum | 84.6% | 65.2% |
| Range | 54.0% | 44.8% |
| Mean | 53.3% | 42.2% |
| Median | 51.8% | 41.7% |
| Interquartile 25% (IQ1) | 48.8% | 35.9% |
| Interquartile 75% (IQ3) | 56.6% | 47.4% |
| Interquartile Range (IQR) | 7.8% | 11.5% |
| Standard Deviation (Sample) | 9.1% | 9.2% |
| Standard Deviation (Population) | 9.0% | 9.1% |
Similar Demographics by Married-couple Households
Demographics Similar to Belgians by Married-couple Households
In terms of married-couple households, the demographic groups most similar to Belgians are Immigrants from Ireland (48.0%, a difference of 0.010%), Afghan (48.0%, a difference of 0.020%), Immigrants from Israel (48.0%, a difference of 0.030%), Cypriot (48.0%, a difference of 0.050%), and French (48.0%, a difference of 0.060%).
| Demographics | Rating | Rank | Married-couple Households |
| Immigrants | Netherlands | 98.2 /100 | #79 | Exceptional 48.2% |
| Russians | 98.1 /100 | #80 | Exceptional 48.2% |
| Finns | 98.0 /100 | #81 | Exceptional 48.1% |
| Immigrants | Poland | 97.7 /100 | #82 | Exceptional 48.1% |
| Guamanians/Chamorros | 97.6 /100 | #83 | Exceptional 48.1% |
| Ukrainians | 97.6 /100 | #84 | Exceptional 48.1% |
| Immigrants | Israel | 97.4 /100 | #85 | Exceptional 48.0% |
| Belgians | 97.4 /100 | #86 | Exceptional 48.0% |
| Immigrants | Ireland | 97.3 /100 | #87 | Exceptional 48.0% |
| Afghans | 97.3 /100 | #88 | Exceptional 48.0% |
| Cypriots | 97.2 /100 | #89 | Exceptional 48.0% |
| French | 97.2 /100 | #90 | Exceptional 48.0% |
| Immigrants | Moldova | 97.0 /100 | #91 | Exceptional 48.0% |
| Palestinians | 96.9 /100 | #92 | Exceptional 48.0% |
| Lebanese | 96.9 /100 | #93 | Exceptional 47.9% |
Demographics Similar to Immigrants from Eritrea by Married-couple Households
In terms of married-couple households, the demographic groups most similar to Immigrants from Eritrea are Sudanese (42.1%, a difference of 0.060%), Chippewa (42.1%, a difference of 0.080%), Honduran (42.1%, a difference of 0.11%), Paiute (42.1%, a difference of 0.11%), and Indonesian (42.0%, a difference of 0.16%).
| Demographics | Rating | Rank | Married-couple Households |
| Immigrants | Guatemala | 0.0 /100 | #281 | Tragic 42.8% |
| Bermudans | 0.0 /100 | #282 | Tragic 42.4% |
| Inupiat | 0.0 /100 | #283 | Tragic 42.4% |
| Cheyenne | 0.0 /100 | #284 | Tragic 42.3% |
| Ghanaians | 0.0 /100 | #285 | Tragic 42.2% |
| Belizeans | 0.0 /100 | #286 | Tragic 42.2% |
| Chippewa | 0.0 /100 | #287 | Tragic 42.1% |
| Immigrants | Eritrea | 0.0 /100 | #288 | Tragic 42.1% |
| Sudanese | 0.0 /100 | #289 | Tragic 42.1% |
| Hondurans | 0.0 /100 | #290 | Tragic 42.1% |
| Paiute | 0.0 /100 | #291 | Tragic 42.1% |
| Indonesians | 0.0 /100 | #292 | Tragic 42.0% |
| Menominee | 0.0 /100 | #293 | Tragic 42.0% |
| Immigrants | Yemen | 0.0 /100 | #294 | Tragic 42.0% |
| Kiowa | 0.0 /100 | #295 | Tragic 42.0% |