Immigrants from Taiwan vs Chickasaw Unemployment Among Women with Children Ages 6 to 17 years

COMPARE

Immigrants from Taiwan
Race
Ancestry
AfghanAfricanAlaska NativeAlaskan AthabascanAlbanianAleutAlsatianAmericanApacheArabArapahoArgentineanArmenianAssyrian/Chaldean/SyriacAustralianAustrianBahamianBangladeshiBarbadianBasqueBelgianBelizeanBermudanBhutaneseBlackfeetBolivianBrazilianBritishBritish West IndianBulgarianBurmeseCajunCambodianCanadianCape VerdeanCarpatho RusynCelticCentral AmericanCentral American IndianCherokeeCheyenneChileanChineseChippewaChoctawColombianColvilleComancheCosta RicanCreeCreekCroatianCrowCubanCypriotCzechCzechoslovakianDanishDelawareDominicanDutchDutch West IndianEastern EuropeanEcuadorianEgyptianEnglishEstonianEthiopianEuropeanFijianFilipinoFinnishFrenchFrench American IndianFrench CanadianGermanGerman RussianGhanaianGreekGuamanian/ChamorroGuatemalanGuyaneseHaitianHmongHonduranHopiHoumaHungarianIcelanderIndian (Asian)IndonesianInupiatIranianIraqiIrishIroquoisIsraeliItalianJamaicanJapaneseJordanianKenyanKiowaKoreanLaotianLatvianLebaneseLiberianLithuanianLumbeeLuxembourgerMacedonianMalaysianMalteseMarshalleseMenomineeMexicanMexican American IndianMongolianMoroccanNative HawaiianNavajoNepaleseNew ZealanderNicaraguanNigerianNorthern EuropeanNorwegianOkinawanOsageOttawaPaiutePakistaniPalestinianPanamanianParaguayanPennsylvania GermanPeruvianPimaPolishPortuguesePotawatomiPuebloPuerto RicanPuget Sound SalishRomanianRussianSalvadoranSamoanScandinavianScotch-IrishScottishSeminoleSenegaleseSerbianShoshoneSierra LeoneanSiouxSlavicSlovakSloveneSomaliSouth AfricanSouth AmericanSouth American IndianSoviet UnionSpaniardSpanishSpanish AmericanSpanish American IndianSri LankanSubsaharan AfricanSudaneseSwedishSwissSyrianTaiwaneseThaiTlingit-HaidaTohono O'OdhamTonganTrinidadian and TobagonianTsimshianTurkishU.S. Virgin IslanderUgandanUkrainianUruguayanUteVenezuelanVietnameseWelshWest IndianYakamaYaquiYugoslavianYumanYup'ikZimbabwean
Immigration
NonimmigrantsImmigrantsAfghanistanAfricaAlbaniaArgentinaArmeniaAsiaAustraliaAustriaBahamasBangladeshBarbadosBelarusBelgiumBelizeBoliviaBosnia and HerzegovinaBrazilBulgariaBurma/MyanmarCabo VerdeCambodiaCameroonCanadaCaribbeanCentral AmericaChileChinaColombiaCongoCosta RicaCroatiaCubaCzechoslovakiaDenmarkDominicaDominican RepublicEastern AfricaEastern AsiaEastern EuropeEcuadorEgyptEl SalvadorEnglandEritreaEthiopiaEuropeFijiFranceGermanyGhanaGreeceGrenadaGuatemalaGuyanaHaitiHondurasHong KongHungaryIndiaIndonesiaIranIraqIrelandIsraelItalyJamaicaJapanJordanKazakhstanKenyaKoreaKuwaitLaosLatin AmericaLatviaLebanonLiberiaLithuaniaMalaysiaMexicoMicronesiaMiddle AfricaMoldovaMoroccoNepalNetherlandsNicaraguaNigeriaNorth AmericaNorth MacedoniaNorthern AfricaNorthern EuropeNorwayOceaniaPakistanPanamaPeruPhilippinesPolandPortugalRomaniaRussiaSaudi ArabiaScotlandSenegalSerbiaSierra LeoneSingaporeSomaliaSouth AfricaSouth AmericaSouth Central AsiaSouth Eastern AsiaSouthern EuropeSpainSri LankaSt. Vincent and the GrenadinesSudanSwedenSwitzerlandSyriaTaiwanThailandTrinidad and TobagoTurkeyUgandaUkraineUruguayUzbekistanVenezuelaVietnamWest IndiesWestern AfricaWestern AsiaWestern EuropeYemenZaireZimbabweAzores
Chickasaw
Race
Ancestry
AfghanAfricanAlaska NativeAlaskan AthabascanAlbanianAleutAlsatianAmericanApacheArabArapahoArgentineanArmenianAssyrian/Chaldean/SyriacAustralianAustrianBahamianBangladeshiBarbadianBasqueBelgianBelizeanBermudanBhutaneseBlackfeetBolivianBrazilianBritishBritish West IndianBulgarianBurmeseCajunCambodianCanadianCape VerdeanCarpatho RusynCelticCentral AmericanCentral American IndianCherokeeCheyenneChickasawChileanChineseChippewaChoctawColombianColvilleComancheCosta RicanCreeCreekCroatianCrowCubanCypriotCzechCzechoslovakianDanishDelawareDominicanDutchDutch West IndianEastern EuropeanEcuadorianEgyptianEnglishEstonianEthiopianEuropeanFijianFilipinoFinnishFrenchFrench American IndianFrench CanadianGermanGerman RussianGhanaianGreekGuamanian/ChamorroGuatemalanGuyaneseHaitianHmongHonduranHopiHoumaHungarianIcelanderIndian (Asian)IndonesianInupiatIranianIraqiIrishIroquoisIsraeliItalianJamaicanJapaneseJordanianKenyanKiowaKoreanLaotianLatvianLebaneseLiberianLithuanianLumbeeLuxembourgerMacedonianMalaysianMalteseMarshalleseMenomineeMexicanMexican American IndianMongolianMoroccanNative HawaiianNavajoNepaleseNew ZealanderNicaraguanNigerianNorthern EuropeanNorwegianOkinawanOsageOttawaPaiutePakistaniPalestinianPanamanianParaguayanPennsylvania GermanPeruvianPimaPolishPortuguesePotawatomiPuebloPuerto RicanPuget Sound SalishRomanianRussianSalvadoranSamoanScandinavianScotch-IrishScottishSeminoleSenegaleseSerbianShoshoneSierra LeoneanSiouxSlavicSlovakSloveneSomaliSouth AfricanSouth AmericanSouth American IndianSoviet UnionSpaniardSpanishSpanish AmericanSpanish American IndianSri LankanSubsaharan AfricanSudaneseSwedishSwissSyrianTaiwaneseThaiTlingit-HaidaTohono O'OdhamTonganTrinidadian and TobagonianTsimshianTurkishU.S. Virgin IslanderUgandanUkrainianUruguayanUteVenezuelanVietnameseWelshWest IndianYakamaYaquiYugoslavianYumanYup'ikZimbabwean
Immigration
NonimmigrantsImmigrantsAfghanistanAfricaAlbaniaArgentinaArmeniaAsiaAustraliaAustriaBahamasBangladeshBarbadosBelarusBelgiumBelizeBoliviaBosnia and HerzegovinaBrazilBulgariaBurma/MyanmarCabo VerdeCambodiaCameroonCanadaCaribbeanCentral AmericaChileChinaColombiaCongoCosta RicaCroatiaCubaCzechoslovakiaDenmarkDominicaDominican RepublicEastern AfricaEastern AsiaEastern EuropeEcuadorEgyptEl SalvadorEnglandEritreaEthiopiaEuropeFijiFranceGermanyGhanaGreeceGrenadaGuatemalaGuyanaHaitiHondurasHong KongHungaryIndiaIndonesiaIranIraqIrelandIsraelItalyJamaicaJapanJordanKazakhstanKenyaKoreaKuwaitLaosLatin AmericaLatviaLebanonLiberiaLithuaniaMalaysiaMexicoMicronesiaMiddle AfricaMoldovaMoroccoNepalNetherlandsNicaraguaNigeriaNorth AmericaNorth MacedoniaNorthern AfricaNorthern EuropeNorwayOceaniaPakistanPanamaPeruPhilippinesPolandPortugalRomaniaRussiaSaudi ArabiaScotlandSenegalSerbiaSierra LeoneSingaporeSomaliaSouth AfricaSouth AmericaSouth Central AsiaSouth Eastern AsiaSouthern EuropeSpainSri LankaSt. Vincent and the GrenadinesSudanSwedenSwitzerlandSyriaThailandTrinidad and TobagoTurkeyUgandaUkraineUruguayUzbekistanVenezuelaVietnamWest IndiesWestern AfricaWestern AsiaWestern EuropeYemenZaireZimbabweAzores
Unemployment Among Women with Children Ages 6 to 17 years
Income
Poverty
Unemployment
Labor Participation
Family Structure
Vehicle Availability
Education Level
Disability

Unemployment Among Women with Children Ages 6 to 17 years Comparison

Immigrants from Taiwan

Chickasaw

Exceptional
Exceptional
7.3%
UNEMPLOYMENT AMONG WOMEN WITH CHILDREN AGES 6 TO 17 YEARS
100.0/ 100
METRIC RATING
11th/ 347
METRIC RANK
8.6%
UNEMPLOYMENT AMONG WOMEN WITH CHILDREN AGES 6 TO 17 YEARS
97.6/ 100
METRIC RATING
107th/ 347
METRIC RANK

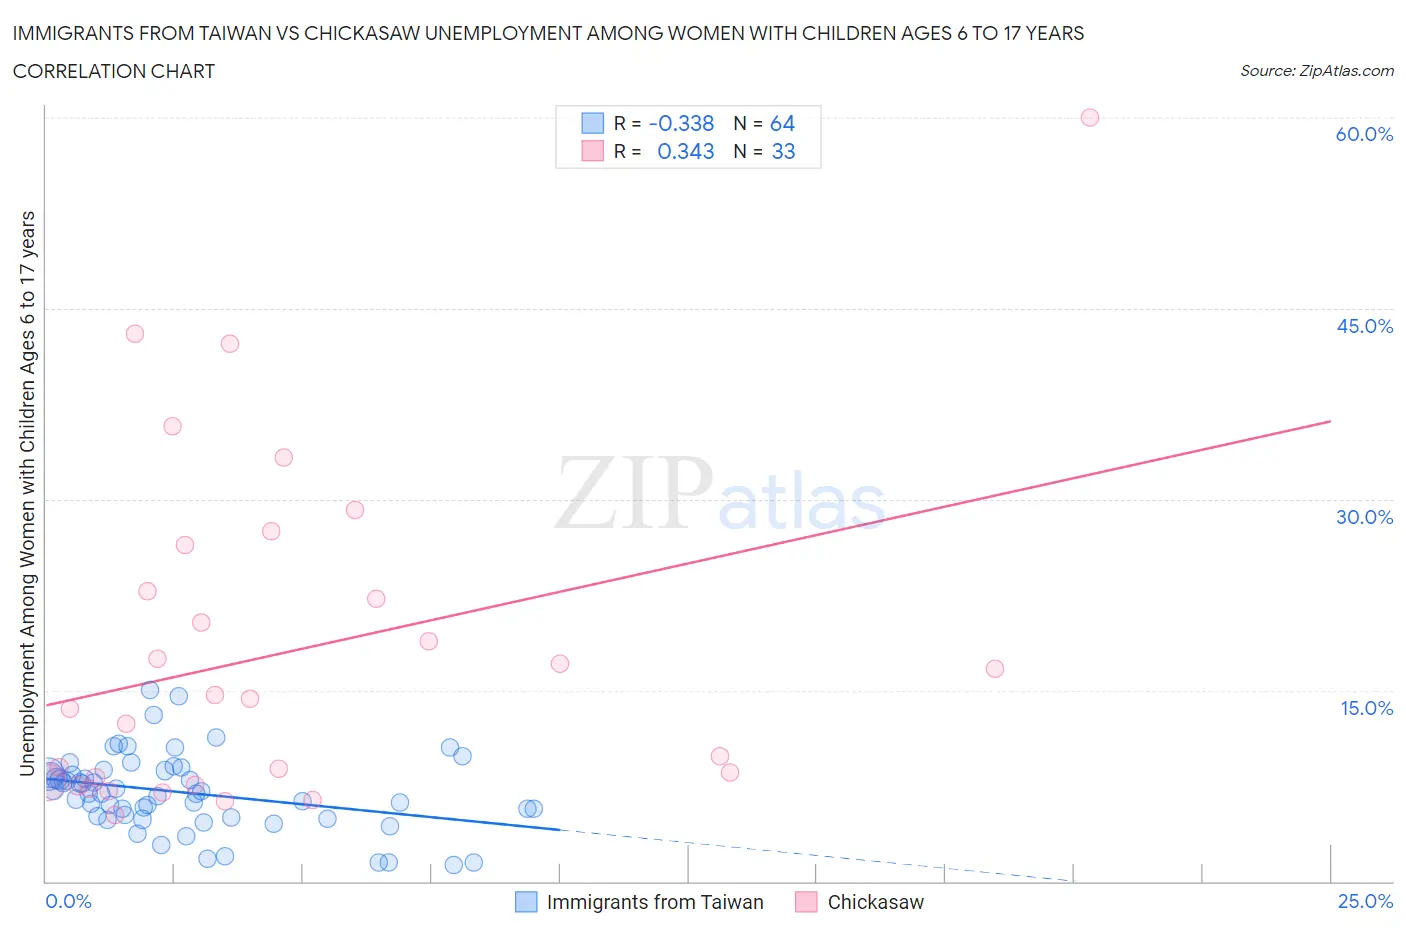
Immigrants from Taiwan vs Chickasaw Unemployment Among Women with Children Ages 6 to 17 years Correlation Chart

The statistical analysis conducted on geographies consisting of 225,183,414 people shows a mild negative correlation between the proportion of Immigrants from Taiwan and unemployment rate among women with children between the ages 6 and 17 in the United States with a correlation coefficient (R) of -0.338 and weighted average of 7.3%. Similarly, the statistical analysis conducted on geographies consisting of 124,393,845 people shows a mild positive correlation between the proportion of Chickasaw and unemployment rate among women with children between the ages 6 and 17 in the United States with a correlation coefficient (R) of 0.343 and weighted average of 8.6%, a difference of 17.3%.
Immigrants from Taiwan vs Chickasaw Unemployment Among Women with Children Ages 6 to 17 years

Unemployment Among Women with Children Ages 6 to 17 years Correlation Summary

MeasurementImmigrants from TaiwanChickasaw
Minimum1.3%5.2%
Maximum15.0%60.0%
Range13.7%54.8%
Mean6.9%18.0%
Median6.9%14.3%
Interquartile 25% (IQ1)5.0%7.6%
Interquartile 75% (IQ3)8.6%24.6%
Interquartile Range (IQR)3.5%17.0%
Standard Deviation (Sample)3.0%13.1%
Standard Deviation (Population)3.0%12.9%

Similar Demographics by Unemployment Among Women with Children Ages 6 to 17 years

Demographics Similar to Immigrants from Taiwan by Unemployment Among Women with Children Ages 6 to 17 years

In terms of unemployment among women with children ages 6 to 17 years, the demographic groups most similar to Immigrants from Taiwan are Bangladeshi (7.4%, a difference of 0.33%), Immigrants from Fiji (7.3%, a difference of 0.70%), Indonesian (7.4%, a difference of 1.0%), Sudanese (7.4%, a difference of 1.1%), and Assyrian/Chaldean/Syriac (7.2%, a difference of 1.7%).
DemographicsRating | RankUnemployment Among Women with Children Ages 6 to 17 years
Ute
100.0
/100
|
#4
Exceptional
7.0%
Okinawans
100.0
/100
|
#5
Exceptional
7.0%
Tlingit-Haida
100.0
/100
|
#6
Exceptional
7.1%
Soviet Union
100.0
/100
|
#7
Exceptional
7.1%
Immigrants | Hong Kong
100.0
/100
|
#8
Exceptional
7.2%
Assyrians/Chaldeans/Syriacs
100.0
/100
|
#9
Exceptional
7.2%
Immigrants | Fiji
100.0
/100
|
#10
Exceptional
7.3%
Immigrants | Taiwan
100.0
/100
|
#11
Exceptional
7.3%
Bangladeshis
100.0
/100
|
#12
Exceptional
7.4%
Indonesians
100.0
/100
|
#13
Exceptional
7.4%
Sudanese
100.0
/100
|
#14
Exceptional
7.4%
Puget Sound Salish
100.0
/100
|
#15
Exceptional
7.5%
Immigrants | Burma/Myanmar
100.0
/100
|
#16
Exceptional
7.5%
Cambodians
100.0
/100
|
#17
Exceptional
7.5%
Afghans
100.0
/100
|
#18
Exceptional
7.6%

Demographics Similar to Chickasaw by Unemployment Among Women with Children Ages 6 to 17 years

In terms of unemployment among women with children ages 6 to 17 years, the demographic groups most similar to Chickasaw are Swedish (8.6%, a difference of 0.010%), Immigrants from Serbia (8.6%, a difference of 0.030%), Immigrants from Norway (8.6%, a difference of 0.070%), Immigrants from Romania (8.6%, a difference of 0.080%), and Latvian (8.6%, a difference of 0.090%).
DemographicsRating | RankUnemployment Among Women with Children Ages 6 to 17 years
New Zealanders
98.4
/100
|
#100
Exceptional
8.6%
Immigrants | Pakistan
98.4
/100
|
#101
Exceptional
8.6%
Immigrants | South Africa
98.3
/100
|
#102
Exceptional
8.6%
Scandinavians
98.3
/100
|
#103
Exceptional
8.6%
Immigrants | France
98.0
/100
|
#104
Exceptional
8.6%
Immigrants | Norway
97.8
/100
|
#105
Exceptional
8.6%
Immigrants | Serbia
97.7
/100
|
#106
Exceptional
8.6%
Chickasaw
97.6
/100
|
#107
Exceptional
8.6%
Swedes
97.6
/100
|
#108
Exceptional
8.6%
Immigrants | Romania
97.5
/100
|
#109
Exceptional
8.6%
Latvians
97.4
/100
|
#110
Exceptional
8.6%
Immigrants | Ukraine
97.4
/100
|
#111
Exceptional
8.6%
Romanians
97.1
/100
|
#112
Exceptional
8.6%
Eastern Europeans
96.8
/100
|
#113
Exceptional
8.6%
Immigrants | Russia
96.7
/100
|
#114
Exceptional
8.6%