Immigrants from Taiwan vs Immigrants from Costa Rica Family Households
COMPARE
Immigrants from Taiwan
Immigrants from Costa Rica
Family Households
Family Households Comparison
Immigrants from Taiwan
Immigrants from Costa Rica
68.0%
FAMILY HOUSEHOLDS
100.0/ 100
METRIC RATING
18th/ 347
METRIC RANK
65.6%
FAMILY HOUSEHOLDS
99.8/ 100
METRIC RATING
79th/ 347
METRIC RANK
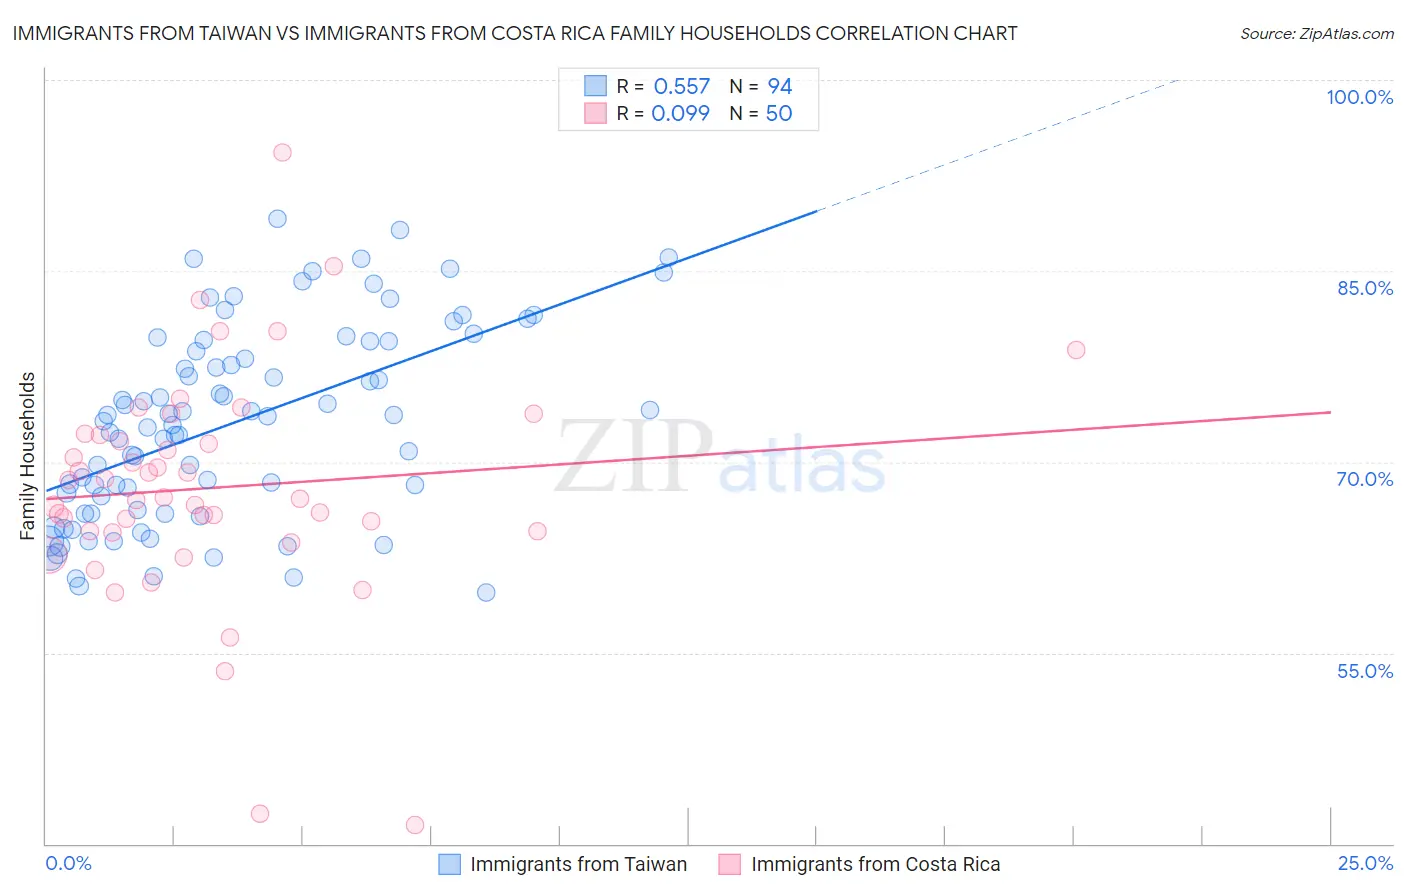
Immigrants from Taiwan vs Immigrants from Costa Rica Family Households Correlation Chart
The statistical analysis conducted on geographies consisting of 298,121,078 people shows a substantial positive correlation between the proportion of Immigrants from Taiwan and percentage of family households in the United States with a correlation coefficient (R) of 0.557 and weighted average of 68.0%. Similarly, the statistical analysis conducted on geographies consisting of 204,251,073 people shows a slight positive correlation between the proportion of Immigrants from Costa Rica and percentage of family households in the United States with a correlation coefficient (R) of 0.099 and weighted average of 65.6%, a difference of 3.7%.
Family Households Correlation Summary
| Measurement | Immigrants from Taiwan | Immigrants from Costa Rica |
| Minimum | 59.8% | 41.4% |
| Maximum | 89.1% | 94.4% |
| Range | 29.3% | 52.9% |
| Mean | 73.0% | 68.0% |
| Median | 73.4% | 67.1% |
| Interquartile 25% (IQ1) | 66.3% | 64.6% |
| Interquartile 75% (IQ3) | 79.4% | 72.1% |
| Interquartile Range (IQR) | 13.2% | 7.5% |
| Standard Deviation (Sample) | 7.6% | 9.0% |
| Standard Deviation (Population) | 7.5% | 9.0% |
Similar Demographics by Family Households
Demographics Similar to Immigrants from Taiwan by Family Households
In terms of family households, the demographic groups most similar to Immigrants from Taiwan are Samoan (67.9%, a difference of 0.12%), Chinese (68.1%, a difference of 0.16%), Immigrants from Vietnam (68.2%, a difference of 0.19%), Assyrian/Chaldean/Syriac (68.2%, a difference of 0.20%), and Pueblo (68.2%, a difference of 0.26%).
| Demographics | Rating | Rank | Family Households |
| Immigrants | Central America | 100.0 /100 | #11 | Exceptional 68.3% |
| Koreans | 100.0 /100 | #12 | Exceptional 68.3% |
| Pueblo | 100.0 /100 | #13 | Exceptional 68.2% |
| Immigrants | Cuba | 100.0 /100 | #14 | Exceptional 68.2% |
| Assyrians/Chaldeans/Syriacs | 100.0 /100 | #15 | Exceptional 68.2% |
| Immigrants | Vietnam | 100.0 /100 | #16 | Exceptional 68.2% |
| Chinese | 100.0 /100 | #17 | Exceptional 68.1% |
| Immigrants | Taiwan | 100.0 /100 | #18 | Exceptional 68.0% |
| Samoans | 100.0 /100 | #19 | Exceptional 67.9% |
| Inupiat | 100.0 /100 | #20 | Exceptional 67.8% |
| Cubans | 100.0 /100 | #21 | Exceptional 67.7% |
| Sri Lankans | 100.0 /100 | #22 | Exceptional 67.7% |
| Immigrants | Pakistan | 100.0 /100 | #23 | Exceptional 67.7% |
| Immigrants | South Eastern Asia | 100.0 /100 | #24 | Exceptional 67.5% |
| Immigrants | Nicaragua | 100.0 /100 | #25 | Exceptional 67.5% |
Demographics Similar to Immigrants from Costa Rica by Family Households
In terms of family households, the demographic groups most similar to Immigrants from Costa Rica are Puget Sound Salish (65.6%, a difference of 0.010%), Yaqui (65.6%, a difference of 0.030%), Immigrants from the Azores (65.6%, a difference of 0.040%), Immigrants from South America (65.6%, a difference of 0.040%), and Jordanian (65.5%, a difference of 0.10%).
| Demographics | Rating | Rank | Family Households |
| Portuguese | 99.9 /100 | #72 | Exceptional 65.8% |
| Laotians | 99.9 /100 | #73 | Exceptional 65.8% |
| Burmese | 99.9 /100 | #74 | Exceptional 65.7% |
| Houma | 99.9 /100 | #75 | Exceptional 65.7% |
| Immigrants | Azores | 99.8 /100 | #76 | Exceptional 65.6% |
| Immigrants | South America | 99.8 /100 | #77 | Exceptional 65.6% |
| Yaqui | 99.8 /100 | #78 | Exceptional 65.6% |
| Immigrants | Costa Rica | 99.8 /100 | #79 | Exceptional 65.6% |
| Puget Sound Salish | 99.8 /100 | #80 | Exceptional 65.6% |
| Jordanians | 99.7 /100 | #81 | Exceptional 65.5% |
| Immigrants | Lebanon | 99.7 /100 | #82 | Exceptional 65.5% |
| Immigrants | Guyana | 99.6 /100 | #83 | Exceptional 65.5% |
| Americans | 99.6 /100 | #84 | Exceptional 65.5% |
| Immigrants | Cambodia | 99.5 /100 | #85 | Exceptional 65.4% |
| Egyptians | 99.4 /100 | #86 | Exceptional 65.4% |