Hawaiian vs Immigrants from Sudan Births to Unmarried Women
COMPARE
Hawaiian
Immigrants from Sudan
Births to Unmarried Women
Births to Unmarried Women Comparison
Hawaiians
Immigrants from Sudan
33.2%
BIRTHS TO UNMARRIED WOMEN
11.3/ 100
METRIC RATING
208th/ 347
METRIC RANK
33.2%
BIRTHS TO UNMARRIED WOMEN
11.5/ 100
METRIC RATING
207th/ 347
METRIC RANK
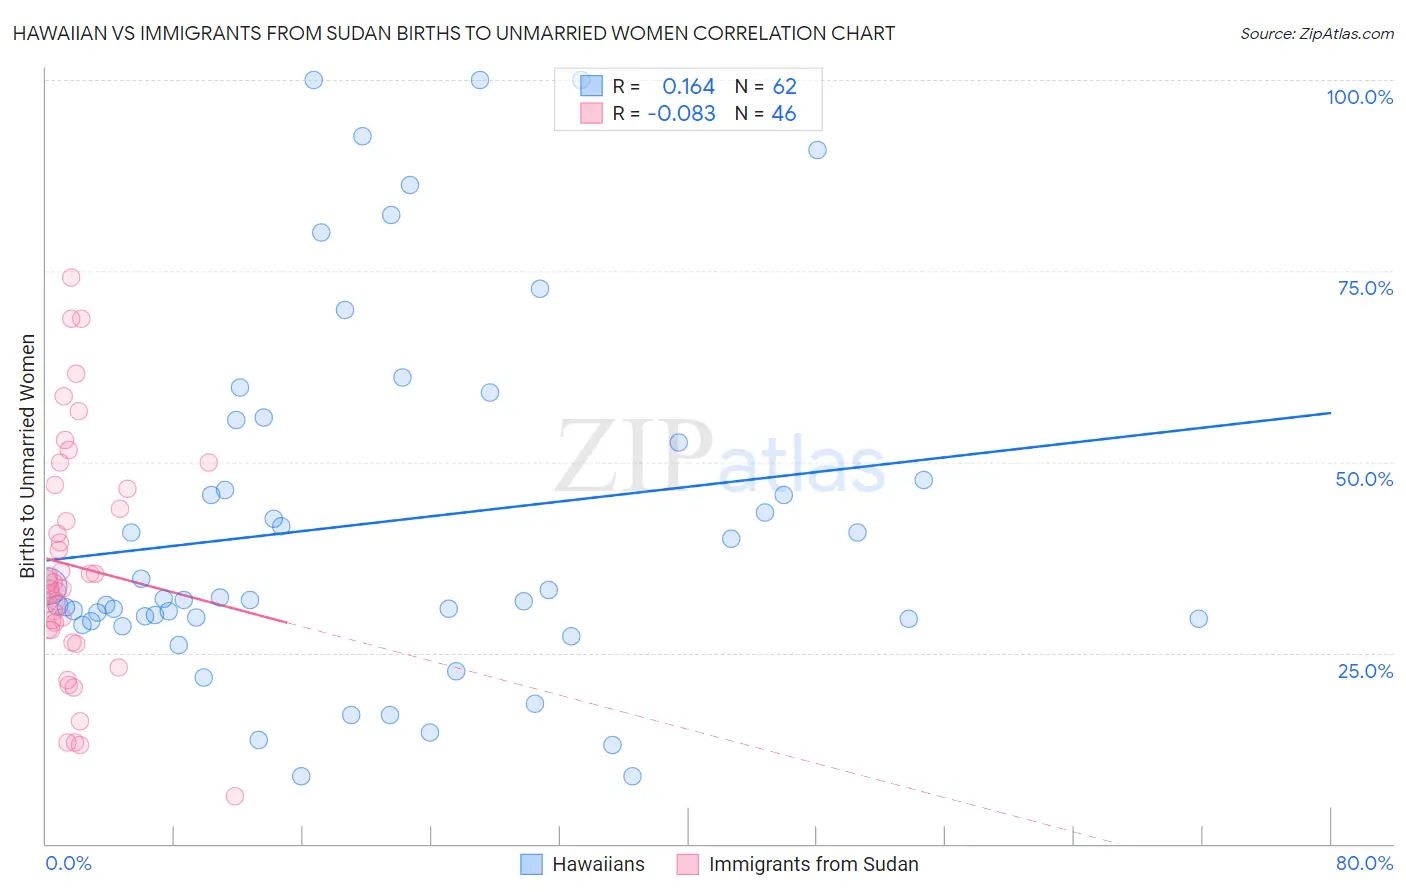
Hawaiian vs Immigrants from Sudan Births to Unmarried Women Correlation Chart
The statistical analysis conducted on geographies consisting of 312,224,673 people shows a poor positive correlation between the proportion of Hawaiians and percentage of births to unmarried women in the United States with a correlation coefficient (R) of 0.164 and weighted average of 33.2%. Similarly, the statistical analysis conducted on geographies consisting of 116,444,182 people shows a slight negative correlation between the proportion of Immigrants from Sudan and percentage of births to unmarried women in the United States with a correlation coefficient (R) of -0.083 and weighted average of 33.2%, a difference of 0.030%.
Births to Unmarried Women Correlation Summary
| Measurement | Hawaiian | Immigrants from Sudan |
| Minimum | 8.9% | 6.3% |
| Maximum | 100.0% | 74.2% |
| Range | 91.1% | 67.9% |
| Mean | 42.0% | 36.3% |
| Median | 31.9% | 33.8% |
| Interquartile 25% (IQ1) | 29.4% | 28.0% |
| Interquartile 75% (IQ3) | 52.6% | 46.4% |
| Interquartile Range (IQR) | 23.2% | 18.4% |
| Standard Deviation (Sample) | 23.6% | 15.4% |
| Standard Deviation (Population) | 23.4% | 15.3% |
Demographics Similar to Hawaiians and Immigrants from Sudan by Births to Unmarried Women
In terms of births to unmarried women, the demographic groups most similar to Hawaiians are White/Caucasian (33.3%, a difference of 0.14%), Scotch-Irish (33.3%, a difference of 0.14%), Ecuadorian (33.3%, a difference of 0.19%), Celtic (33.3%, a difference of 0.25%), and Uruguayan (33.1%, a difference of 0.32%). Similarly, the demographic groups most similar to Immigrants from Sudan are White/Caucasian (33.3%, a difference of 0.17%), Scotch-Irish (33.3%, a difference of 0.17%), Ecuadorian (33.3%, a difference of 0.22%), Uruguayan (33.1%, a difference of 0.29%), and Celtic (33.3%, a difference of 0.29%).
| Demographics | Rating | Rank | Births to Unmarried Women |
| Immigrants | Immigrants | 20.6 /100 | #197 | Fair 32.7% |
| Costa Ricans | 20.3 /100 | #198 | Fair 32.7% |
| Immigrants | Thailand | 18.9 /100 | #199 | Poor 32.8% |
| Immigrants | Germany | 18.8 /100 | #200 | Poor 32.8% |
| Immigrants | Burma/Myanmar | 16.7 /100 | #201 | Poor 32.9% |
| Immigrants | Micronesia | 16.6 /100 | #202 | Poor 32.9% |
| Ute | 14.4 /100 | #203 | Poor 33.0% |
| Immigrants | Africa | 14.3 /100 | #204 | Poor 33.0% |
| German Russians | 13.1 /100 | #205 | Poor 33.1% |
| Uruguayans | 12.8 /100 | #206 | Poor 33.1% |
| Immigrants | Sudan | 11.5 /100 | #207 | Poor 33.2% |
| Hawaiians | 11.3 /100 | #208 | Poor 33.2% |
| Whites/Caucasians | 10.7 /100 | #209 | Poor 33.3% |
| Scotch-Irish | 10.7 /100 | #210 | Poor 33.3% |
| Ecuadorians | 10.5 /100 | #211 | Poor 33.3% |
| Celtics | 10.2 /100 | #212 | Poor 33.3% |
| Immigrants | Costa Rica | 9.5 /100 | #213 | Tragic 33.4% |
| Slovaks | 9.3 /100 | #214 | Tragic 33.4% |
| French | 8.7 /100 | #215 | Tragic 33.4% |
| Nepalese | 7.8 /100 | #216 | Tragic 33.5% |
| Spaniards | 7.0 /100 | #217 | Tragic 33.6% |