Hawaiian vs Egyptian Births to Unmarried Women
COMPARE
Hawaiian
Egyptian
Births to Unmarried Women
Births to Unmarried Women Comparison
Hawaiians
Egyptians
33.2%
BIRTHS TO UNMARRIED WOMEN
11.3/ 100
METRIC RATING
208th/ 347
METRIC RANK
28.2%
BIRTHS TO UNMARRIED WOMEN
99.0/ 100
METRIC RATING
62nd/ 347
METRIC RANK
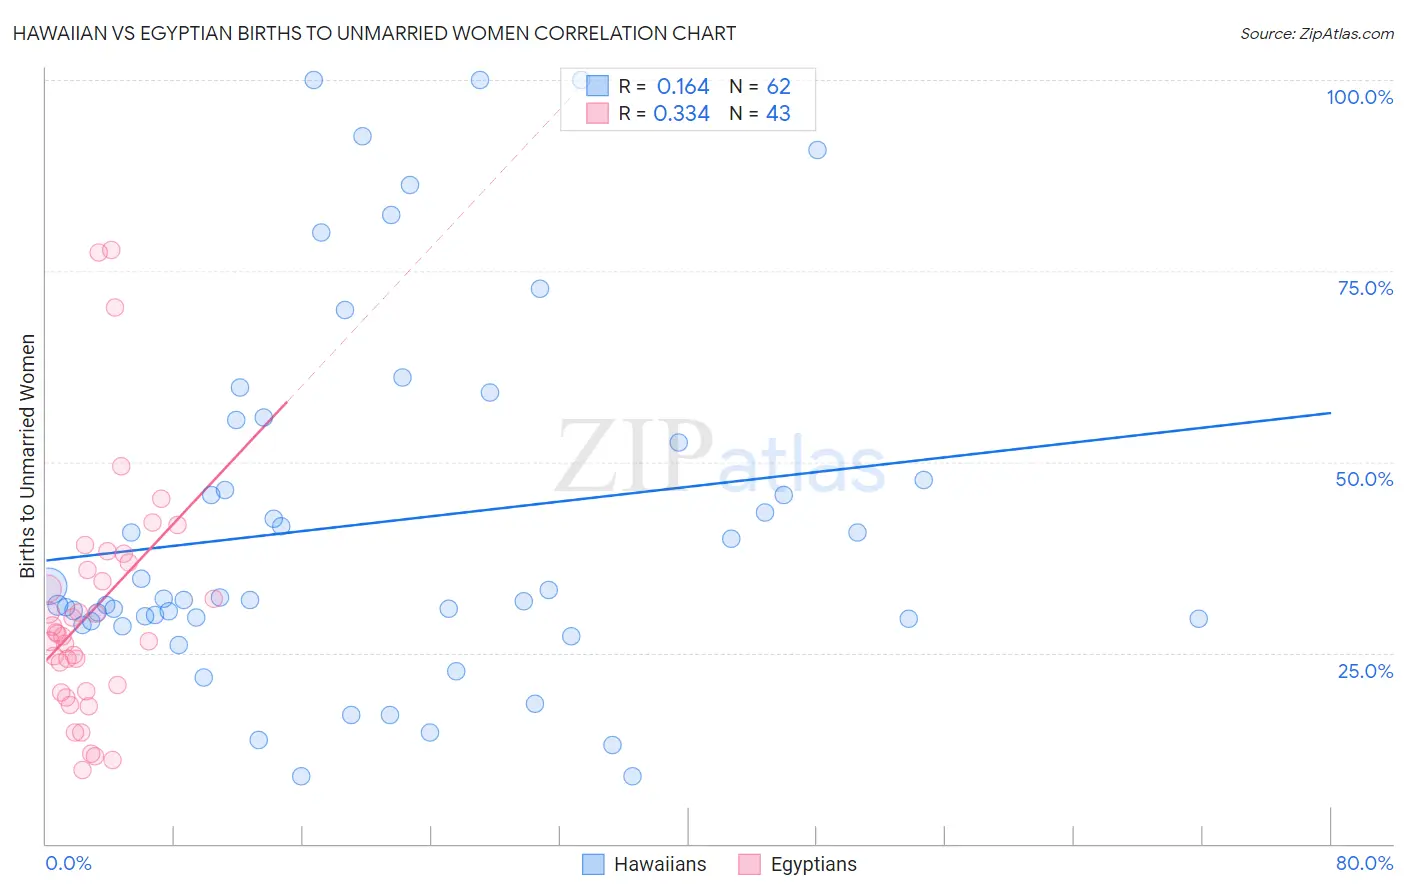
Hawaiian vs Egyptian Births to Unmarried Women Correlation Chart
The statistical analysis conducted on geographies consisting of 312,224,673 people shows a poor positive correlation between the proportion of Hawaiians and percentage of births to unmarried women in the United States with a correlation coefficient (R) of 0.164 and weighted average of 33.2%. Similarly, the statistical analysis conducted on geographies consisting of 261,953,524 people shows a mild positive correlation between the proportion of Egyptians and percentage of births to unmarried women in the United States with a correlation coefficient (R) of 0.334 and weighted average of 28.2%, a difference of 17.6%.
Births to Unmarried Women Correlation Summary
| Measurement | Hawaiian | Egyptian |
| Minimum | 8.9% | 9.6% |
| Maximum | 100.0% | 77.8% |
| Range | 91.1% | 68.2% |
| Mean | 42.0% | 30.5% |
| Median | 31.9% | 27.5% |
| Interquartile 25% (IQ1) | 29.4% | 20.0% |
| Interquartile 75% (IQ3) | 52.6% | 36.9% |
| Interquartile Range (IQR) | 23.2% | 16.9% |
| Standard Deviation (Sample) | 23.6% | 15.6% |
| Standard Deviation (Population) | 23.4% | 15.4% |
Similar Demographics by Births to Unmarried Women
Demographics Similar to Hawaiians by Births to Unmarried Women
In terms of births to unmarried women, the demographic groups most similar to Hawaiians are Immigrants from Sudan (33.2%, a difference of 0.030%), White/Caucasian (33.3%, a difference of 0.14%), Scotch-Irish (33.3%, a difference of 0.14%), Ecuadorian (33.3%, a difference of 0.19%), and Celtic (33.3%, a difference of 0.25%).
| Demographics | Rating | Rank | Births to Unmarried Women |
| Immigrants | Burma/Myanmar | 16.7 /100 | #201 | Poor 32.9% |
| Immigrants | Micronesia | 16.6 /100 | #202 | Poor 32.9% |
| Ute | 14.4 /100 | #203 | Poor 33.0% |
| Immigrants | Africa | 14.3 /100 | #204 | Poor 33.0% |
| German Russians | 13.1 /100 | #205 | Poor 33.1% |
| Uruguayans | 12.8 /100 | #206 | Poor 33.1% |
| Immigrants | Sudan | 11.5 /100 | #207 | Poor 33.2% |
| Hawaiians | 11.3 /100 | #208 | Poor 33.2% |
| Whites/Caucasians | 10.7 /100 | #209 | Poor 33.3% |
| Scotch-Irish | 10.7 /100 | #210 | Poor 33.3% |
| Ecuadorians | 10.5 /100 | #211 | Poor 33.3% |
| Celtics | 10.2 /100 | #212 | Poor 33.3% |
| Immigrants | Costa Rica | 9.5 /100 | #213 | Tragic 33.4% |
| Slovaks | 9.3 /100 | #214 | Tragic 33.4% |
| French | 8.7 /100 | #215 | Tragic 33.4% |
Demographics Similar to Egyptians by Births to Unmarried Women
In terms of births to unmarried women, the demographic groups most similar to Egyptians are Immigrants from Serbia (28.3%, a difference of 0.14%), Immigrants from North Macedonia (28.1%, a difference of 0.32%), Immigrants from Turkey (28.1%, a difference of 0.36%), Immigrants from Kazakhstan (28.1%, a difference of 0.41%), and Tongan (28.4%, a difference of 0.53%).
| Demographics | Rating | Rank | Births to Unmarried Women |
| Mongolians | 99.3 /100 | #55 | Exceptional 27.9% |
| Immigrants | Belgium | 99.3 /100 | #56 | Exceptional 28.0% |
| Russians | 99.2 /100 | #57 | Exceptional 28.0% |
| Immigrants | Albania | 99.2 /100 | #58 | Exceptional 28.0% |
| Immigrants | Kazakhstan | 99.1 /100 | #59 | Exceptional 28.1% |
| Immigrants | Turkey | 99.1 /100 | #60 | Exceptional 28.1% |
| Immigrants | North Macedonia | 99.1 /100 | #61 | Exceptional 28.1% |
| Egyptians | 99.0 /100 | #62 | Exceptional 28.2% |
| Immigrants | Serbia | 98.9 /100 | #63 | Exceptional 28.3% |
| Tongans | 98.8 /100 | #64 | Exceptional 28.4% |
| Immigrants | Czechoslovakia | 98.8 /100 | #65 | Exceptional 28.4% |
| Immigrants | Egypt | 98.8 /100 | #66 | Exceptional 28.4% |
| Palestinians | 98.7 /100 | #67 | Exceptional 28.4% |
| Immigrants | Europe | 98.7 /100 | #68 | Exceptional 28.4% |
| Bolivians | 98.7 /100 | #69 | Exceptional 28.5% |