Kiowa vs Immigrants from Sudan Births to Unmarried Women
COMPARE
Kiowa
Immigrants from Sudan
Births to Unmarried Women
Births to Unmarried Women Comparison
Kiowa
Immigrants from Sudan
43.1%
BIRTHS TO UNMARRIED WOMEN
0.0/ 100
METRIC RATING
332nd/ 347
METRIC RANK
33.2%
BIRTHS TO UNMARRIED WOMEN
11.5/ 100
METRIC RATING
207th/ 347
METRIC RANK
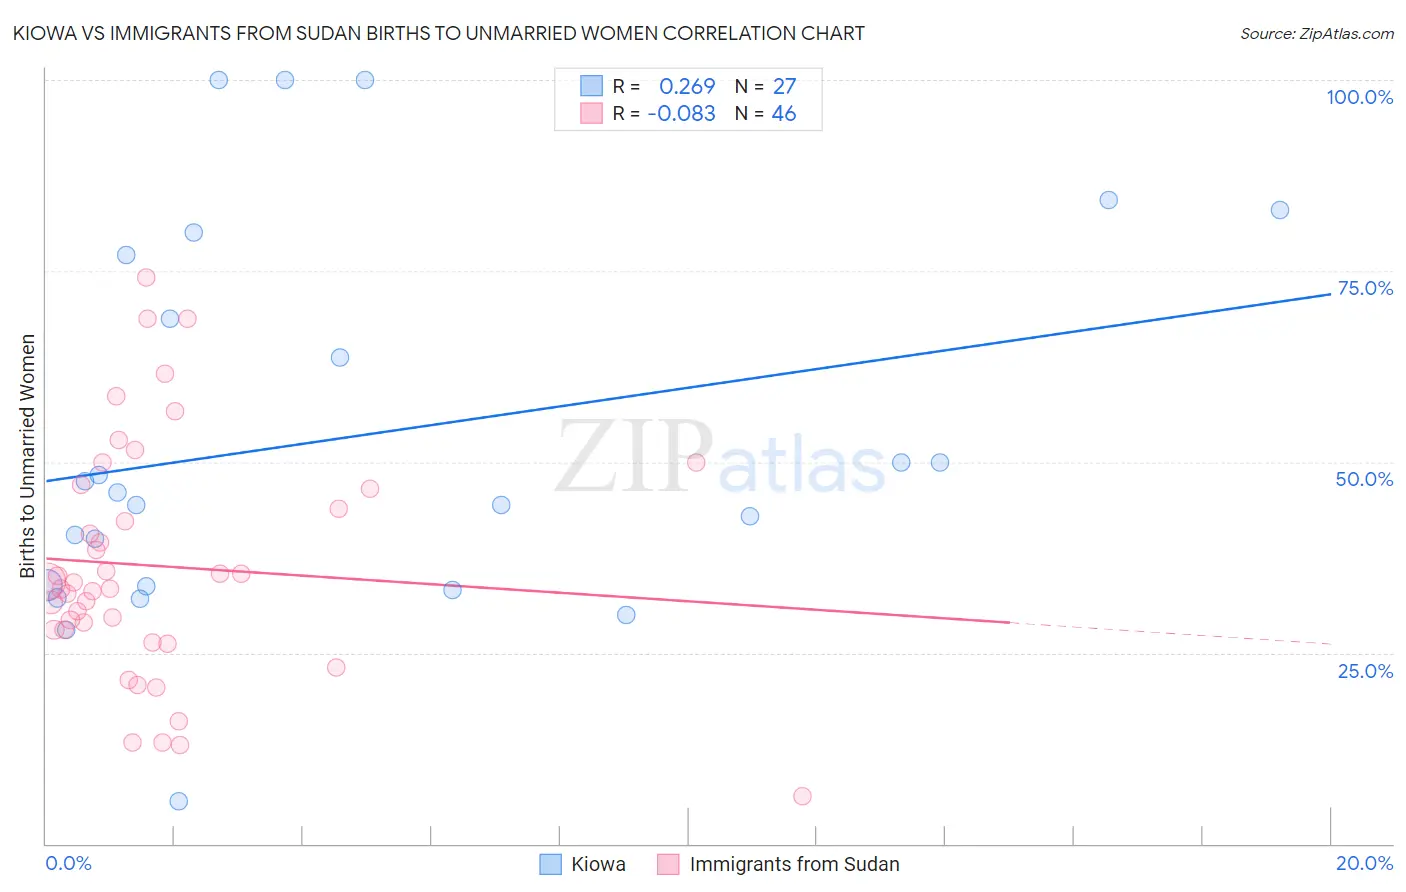
Kiowa vs Immigrants from Sudan Births to Unmarried Women Correlation Chart
The statistical analysis conducted on geographies consisting of 55,598,383 people shows a weak positive correlation between the proportion of Kiowa and percentage of births to unmarried women in the United States with a correlation coefficient (R) of 0.269 and weighted average of 43.1%. Similarly, the statistical analysis conducted on geographies consisting of 116,444,182 people shows a slight negative correlation between the proportion of Immigrants from Sudan and percentage of births to unmarried women in the United States with a correlation coefficient (R) of -0.083 and weighted average of 33.2%, a difference of 29.9%.
Births to Unmarried Women Correlation Summary
| Measurement | Kiowa | Immigrants from Sudan |
| Minimum | 5.6% | 6.3% |
| Maximum | 100.0% | 74.2% |
| Range | 94.4% | 67.9% |
| Mean | 53.3% | 36.3% |
| Median | 46.0% | 33.8% |
| Interquartile 25% (IQ1) | 33.8% | 28.0% |
| Interquartile 75% (IQ3) | 77.0% | 46.4% |
| Interquartile Range (IQR) | 43.2% | 18.4% |
| Standard Deviation (Sample) | 25.0% | 15.4% |
| Standard Deviation (Population) | 24.5% | 15.3% |
Similar Demographics by Births to Unmarried Women
Demographics Similar to Kiowa by Births to Unmarried Women
In terms of births to unmarried women, the demographic groups most similar to Kiowa are Native/Alaskan (43.0%, a difference of 0.35%), Chippewa (42.6%, a difference of 1.2%), Paiute (42.5%, a difference of 1.6%), Immigrants from Cabo Verde (42.2%, a difference of 2.2%), and Tsimshian (42.2%, a difference of 2.3%).
| Demographics | Rating | Rank | Births to Unmarried Women |
| Cheyenne | 0.0 /100 | #325 | Tragic 41.3% |
| Immigrants | Cuba | 0.0 /100 | #326 | Tragic 41.5% |
| Tsimshian | 0.0 /100 | #327 | Tragic 42.2% |
| Immigrants | Cabo Verde | 0.0 /100 | #328 | Tragic 42.2% |
| Paiute | 0.0 /100 | #329 | Tragic 42.5% |
| Chippewa | 0.0 /100 | #330 | Tragic 42.6% |
| Natives/Alaskans | 0.0 /100 | #331 | Tragic 43.0% |
| Kiowa | 0.0 /100 | #332 | Tragic 43.1% |
| Blacks/African Americans | 0.0 /100 | #333 | Tragic 44.3% |
| Yuman | 0.0 /100 | #334 | Tragic 44.4% |
| Colville | 0.0 /100 | #335 | Tragic 45.3% |
| Puerto Ricans | 0.0 /100 | #336 | Tragic 45.7% |
| Houma | 0.0 /100 | #337 | Tragic 46.6% |
| Arapaho | 0.0 /100 | #338 | Tragic 47.1% |
| Lumbee | 0.0 /100 | #339 | Tragic 48.2% |
Demographics Similar to Immigrants from Sudan by Births to Unmarried Women
In terms of births to unmarried women, the demographic groups most similar to Immigrants from Sudan are Hawaiian (33.2%, a difference of 0.030%), White/Caucasian (33.3%, a difference of 0.17%), Scotch-Irish (33.3%, a difference of 0.17%), Ecuadorian (33.3%, a difference of 0.22%), and Uruguayan (33.1%, a difference of 0.29%).
| Demographics | Rating | Rank | Births to Unmarried Women |
| Immigrants | Germany | 18.8 /100 | #200 | Poor 32.8% |
| Immigrants | Burma/Myanmar | 16.7 /100 | #201 | Poor 32.9% |
| Immigrants | Micronesia | 16.6 /100 | #202 | Poor 32.9% |
| Ute | 14.4 /100 | #203 | Poor 33.0% |
| Immigrants | Africa | 14.3 /100 | #204 | Poor 33.0% |
| German Russians | 13.1 /100 | #205 | Poor 33.1% |
| Uruguayans | 12.8 /100 | #206 | Poor 33.1% |
| Immigrants | Sudan | 11.5 /100 | #207 | Poor 33.2% |
| Hawaiians | 11.3 /100 | #208 | Poor 33.2% |
| Whites/Caucasians | 10.7 /100 | #209 | Poor 33.3% |
| Scotch-Irish | 10.7 /100 | #210 | Poor 33.3% |
| Ecuadorians | 10.5 /100 | #211 | Poor 33.3% |
| Celtics | 10.2 /100 | #212 | Poor 33.3% |
| Immigrants | Costa Rica | 9.5 /100 | #213 | Tragic 33.4% |
| Slovaks | 9.3 /100 | #214 | Tragic 33.4% |