Hawaiian vs Immigrants from Sudan Single Female Poverty
COMPARE
Hawaiian
Immigrants from Sudan
Single Female Poverty
Single Female Poverty Comparison
Hawaiians
Immigrants from Sudan
21.2%
SINGLE FEMALE POVERTY
37.7/ 100
METRIC RATING
186th/ 347
METRIC RANK
22.6%
SINGLE FEMALE POVERTY
0.8/ 100
METRIC RATING
255th/ 347
METRIC RANK
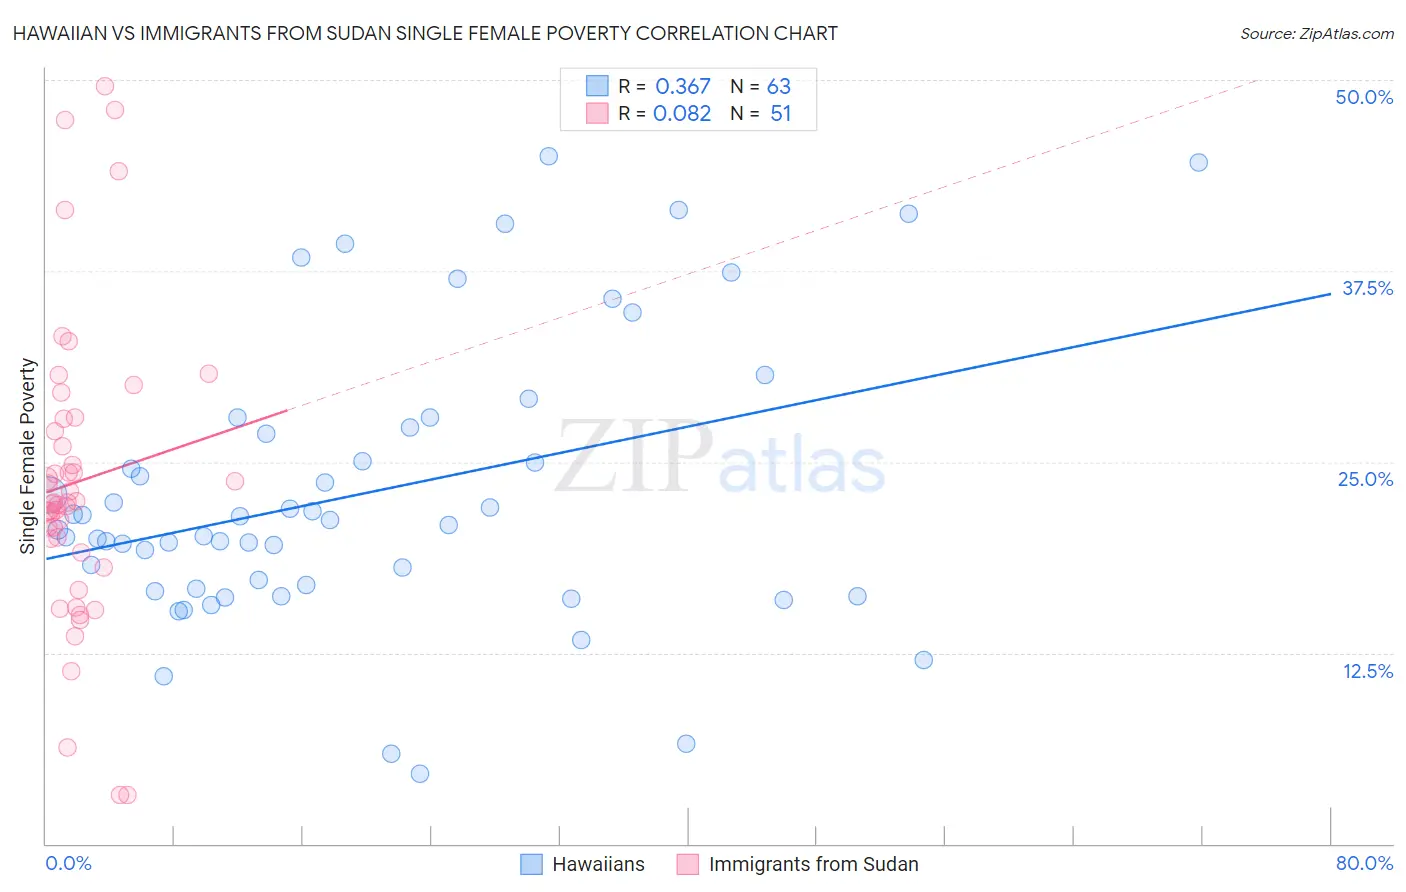
Hawaiian vs Immigrants from Sudan Single Female Poverty Correlation Chart
The statistical analysis conducted on geographies consisting of 324,430,861 people shows a mild positive correlation between the proportion of Hawaiians and poverty level among single females in the United States with a correlation coefficient (R) of 0.367 and weighted average of 21.2%. Similarly, the statistical analysis conducted on geographies consisting of 118,406,629 people shows a slight positive correlation between the proportion of Immigrants from Sudan and poverty level among single females in the United States with a correlation coefficient (R) of 0.082 and weighted average of 22.6%, a difference of 6.6%.
Single Female Poverty Correlation Summary
| Measurement | Hawaiian | Immigrants from Sudan |
| Minimum | 4.5% | 3.2% |
| Maximum | 45.0% | 49.6% |
| Range | 40.5% | 46.4% |
| Mean | 23.0% | 23.7% |
| Median | 20.9% | 22.4% |
| Interquartile 25% (IQ1) | 16.7% | 19.0% |
| Interquartile 75% (IQ3) | 27.3% | 27.8% |
| Interquartile Range (IQR) | 10.5% | 8.8% |
| Standard Deviation (Sample) | 9.3% | 9.9% |
| Standard Deviation (Population) | 9.2% | 9.8% |
Similar Demographics by Single Female Poverty
Demographics Similar to Hawaiians by Single Female Poverty
In terms of single female poverty, the demographic groups most similar to Hawaiians are Immigrants from Cambodia (21.2%, a difference of 0.040%), Immigrants from Nigeria (21.2%, a difference of 0.060%), Hungarian (21.1%, a difference of 0.13%), Slovak (21.1%, a difference of 0.14%), and Yugoslavian (21.2%, a difference of 0.15%).
| Demographics | Rating | Rank | Single Female Poverty |
| British | 42.9 /100 | #179 | Average 21.1% |
| Spanish American Indians | 42.5 /100 | #180 | Average 21.1% |
| Europeans | 42.3 /100 | #181 | Average 21.1% |
| Slavs | 40.5 /100 | #182 | Average 21.1% |
| Slovaks | 39.7 /100 | #183 | Fair 21.1% |
| Hungarians | 39.6 /100 | #184 | Fair 21.1% |
| Immigrants | Cambodia | 38.2 /100 | #185 | Fair 21.2% |
| Hawaiians | 37.7 /100 | #186 | Fair 21.2% |
| Immigrants | Nigeria | 36.8 /100 | #187 | Fair 21.2% |
| Yugoslavians | 35.4 /100 | #188 | Fair 21.2% |
| Immigrants | Cuba | 35.3 /100 | #189 | Fair 21.2% |
| Trinidadians and Tobagonians | 35.2 /100 | #190 | Fair 21.2% |
| Immigrants | Germany | 31.1 /100 | #191 | Fair 21.3% |
| Immigrants | Jamaica | 30.5 /100 | #192 | Fair 21.3% |
| Basques | 28.1 /100 | #193 | Fair 21.3% |
Demographics Similar to Immigrants from Sudan by Single Female Poverty
In terms of single female poverty, the demographic groups most similar to Immigrants from Sudan are Immigrants from Burma/Myanmar (22.6%, a difference of 0.0%), Immigrants from Liberia (22.5%, a difference of 0.10%), Immigrants from Belize (22.6%, a difference of 0.14%), Delaware (22.5%, a difference of 0.19%), and Sudanese (22.6%, a difference of 0.29%).
| Demographics | Rating | Rank | Single Female Poverty |
| Belizeans | 1.4 /100 | #248 | Tragic 22.4% |
| Immigrants | Caribbean | 1.3 /100 | #249 | Tragic 22.4% |
| Immigrants | Bahamas | 1.2 /100 | #250 | Tragic 22.5% |
| Immigrants | West Indies | 1.0 /100 | #251 | Tragic 22.5% |
| Delaware | 1.0 /100 | #252 | Tragic 22.5% |
| Immigrants | Liberia | 0.9 /100 | #253 | Tragic 22.5% |
| Immigrants | Burma/Myanmar | 0.8 /100 | #254 | Tragic 22.6% |
| Immigrants | Sudan | 0.8 /100 | #255 | Tragic 22.6% |
| Immigrants | Belize | 0.8 /100 | #256 | Tragic 22.6% |
| Sudanese | 0.7 /100 | #257 | Tragic 22.6% |
| Bahamians | 0.6 /100 | #258 | Tragic 22.7% |
| Whites/Caucasians | 0.6 /100 | #259 | Tragic 22.7% |
| Celtics | 0.5 /100 | #260 | Tragic 22.7% |
| Immigrants | Cabo Verde | 0.4 /100 | #261 | Tragic 22.8% |
| British West Indians | 0.4 /100 | #262 | Tragic 22.8% |