Turkish vs Immigrants from Sudan Births to Unmarried Women
COMPARE
Turkish
Immigrants from Sudan
Births to Unmarried Women
Births to Unmarried Women Comparison
Turks
Immigrants from Sudan
27.4%
BIRTHS TO UNMARRIED WOMEN
99.6/ 100
METRIC RATING
40th/ 347
METRIC RANK
33.2%
BIRTHS TO UNMARRIED WOMEN
11.5/ 100
METRIC RATING
207th/ 347
METRIC RANK
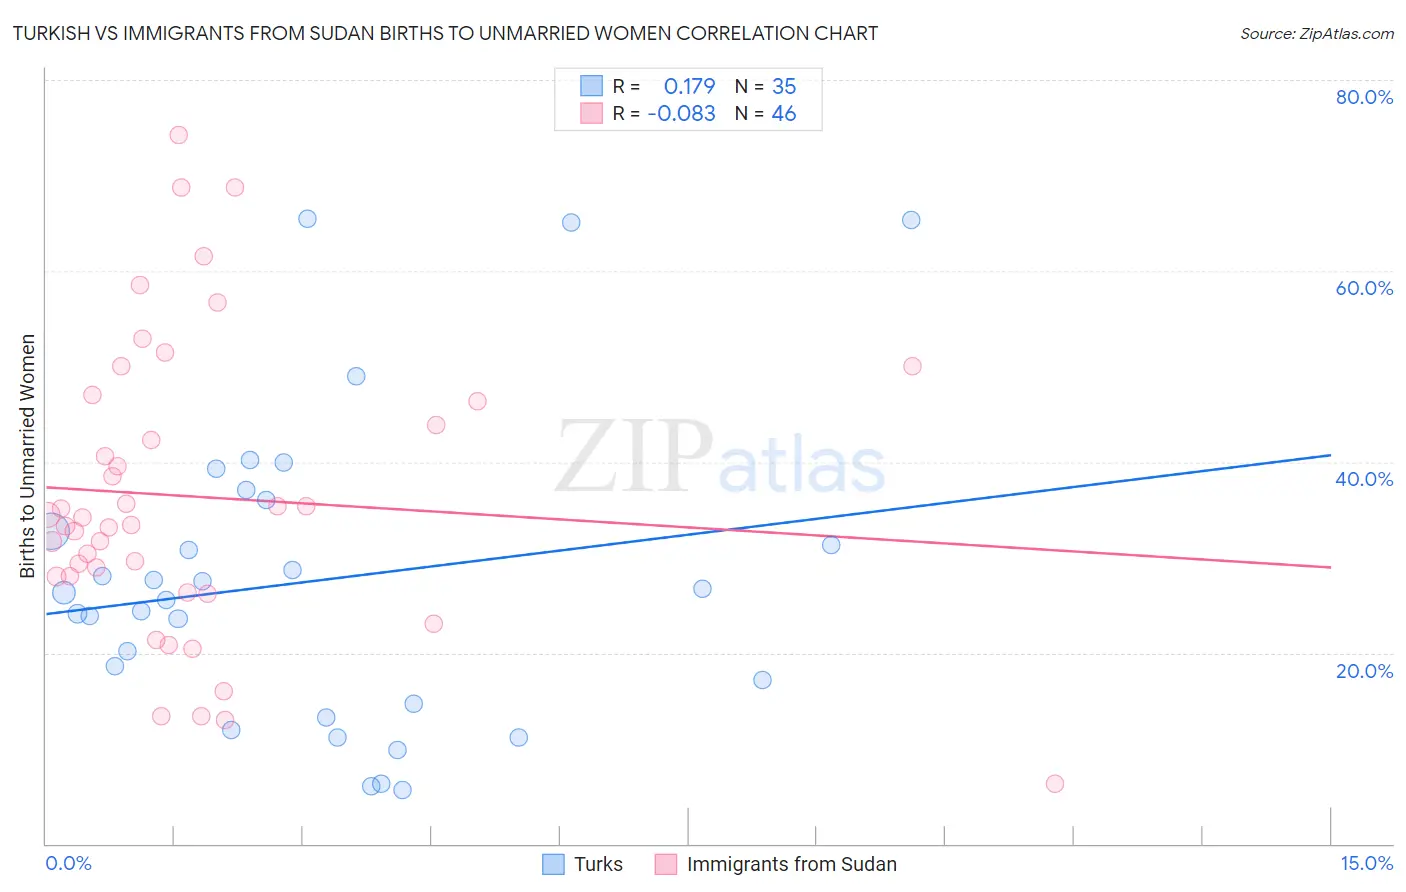
Turkish vs Immigrants from Sudan Births to Unmarried Women Correlation Chart
The statistical analysis conducted on geographies consisting of 255,026,742 people shows a poor positive correlation between the proportion of Turks and percentage of births to unmarried women in the United States with a correlation coefficient (R) of 0.179 and weighted average of 27.4%. Similarly, the statistical analysis conducted on geographies consisting of 116,444,182 people shows a slight negative correlation between the proportion of Immigrants from Sudan and percentage of births to unmarried women in the United States with a correlation coefficient (R) of -0.083 and weighted average of 33.2%, a difference of 21.0%.
Births to Unmarried Women Correlation Summary
| Measurement | Turkish | Immigrants from Sudan |
| Minimum | 5.6% | 6.3% |
| Maximum | 65.5% | 74.2% |
| Range | 59.9% | 67.9% |
| Mean | 27.5% | 36.3% |
| Median | 26.3% | 33.8% |
| Interquartile 25% (IQ1) | 14.6% | 28.0% |
| Interquartile 75% (IQ3) | 36.0% | 46.4% |
| Interquartile Range (IQR) | 21.4% | 18.4% |
| Standard Deviation (Sample) | 15.9% | 15.4% |
| Standard Deviation (Population) | 15.7% | 15.3% |
Similar Demographics by Births to Unmarried Women
Demographics Similar to Turks by Births to Unmarried Women
In terms of births to unmarried women, the demographic groups most similar to Turks are Immigrants from Malaysia (27.4%, a difference of 0.32%), Iraqi (27.6%, a difference of 0.41%), Immigrants from Eastern Europe (27.6%, a difference of 0.43%), Immigrants from Moldova (27.3%, a difference of 0.61%), and Immigrants from Bulgaria (27.6%, a difference of 0.66%).
| Demographics | Rating | Rank | Births to Unmarried Women |
| Immigrants | Sri Lanka | 99.8 /100 | #33 | Exceptional 27.2% |
| Immigrants | Pakistan | 99.8 /100 | #34 | Exceptional 27.2% |
| Immigrants | Ireland | 99.7 /100 | #35 | Exceptional 27.2% |
| Immigrants | Western Asia | 99.7 /100 | #36 | Exceptional 27.2% |
| Immigrants | Ukraine | 99.7 /100 | #37 | Exceptional 27.2% |
| Immigrants | Moldova | 99.7 /100 | #38 | Exceptional 27.3% |
| Immigrants | Malaysia | 99.7 /100 | #39 | Exceptional 27.4% |
| Turks | 99.6 /100 | #40 | Exceptional 27.4% |
| Iraqis | 99.6 /100 | #41 | Exceptional 27.6% |
| Immigrants | Eastern Europe | 99.6 /100 | #42 | Exceptional 27.6% |
| Immigrants | Bulgaria | 99.6 /100 | #43 | Exceptional 27.6% |
| Immigrants | Indonesia | 99.5 /100 | #44 | Exceptional 27.7% |
| Latvians | 99.5 /100 | #45 | Exceptional 27.7% |
| Immigrants | Lithuania | 99.5 /100 | #46 | Exceptional 27.7% |
| Hmong | 99.5 /100 | #47 | Exceptional 27.7% |
Demographics Similar to Immigrants from Sudan by Births to Unmarried Women
In terms of births to unmarried women, the demographic groups most similar to Immigrants from Sudan are Hawaiian (33.2%, a difference of 0.030%), White/Caucasian (33.3%, a difference of 0.17%), Scotch-Irish (33.3%, a difference of 0.17%), Ecuadorian (33.3%, a difference of 0.22%), and Uruguayan (33.1%, a difference of 0.29%).
| Demographics | Rating | Rank | Births to Unmarried Women |
| Immigrants | Germany | 18.8 /100 | #200 | Poor 32.8% |
| Immigrants | Burma/Myanmar | 16.7 /100 | #201 | Poor 32.9% |
| Immigrants | Micronesia | 16.6 /100 | #202 | Poor 32.9% |
| Ute | 14.4 /100 | #203 | Poor 33.0% |
| Immigrants | Africa | 14.3 /100 | #204 | Poor 33.0% |
| German Russians | 13.1 /100 | #205 | Poor 33.1% |
| Uruguayans | 12.8 /100 | #206 | Poor 33.1% |
| Immigrants | Sudan | 11.5 /100 | #207 | Poor 33.2% |
| Hawaiians | 11.3 /100 | #208 | Poor 33.2% |
| Whites/Caucasians | 10.7 /100 | #209 | Poor 33.3% |
| Scotch-Irish | 10.7 /100 | #210 | Poor 33.3% |
| Ecuadorians | 10.5 /100 | #211 | Poor 33.3% |
| Celtics | 10.2 /100 | #212 | Poor 33.3% |
| Immigrants | Costa Rica | 9.5 /100 | #213 | Tragic 33.4% |
| Slovaks | 9.3 /100 | #214 | Tragic 33.4% |