Hawaiian vs Immigrants from Sudan Family Poverty
COMPARE
Hawaiian
Immigrants from Sudan
Family Poverty
Family Poverty Comparison
Hawaiians
Immigrants from Sudan
9.0%
FAMILY POVERTY
47.2/ 100
METRIC RATING
177th/ 347
METRIC RANK
10.1%
FAMILY POVERTY
2.3/ 100
METRIC RATING
232nd/ 347
METRIC RANK
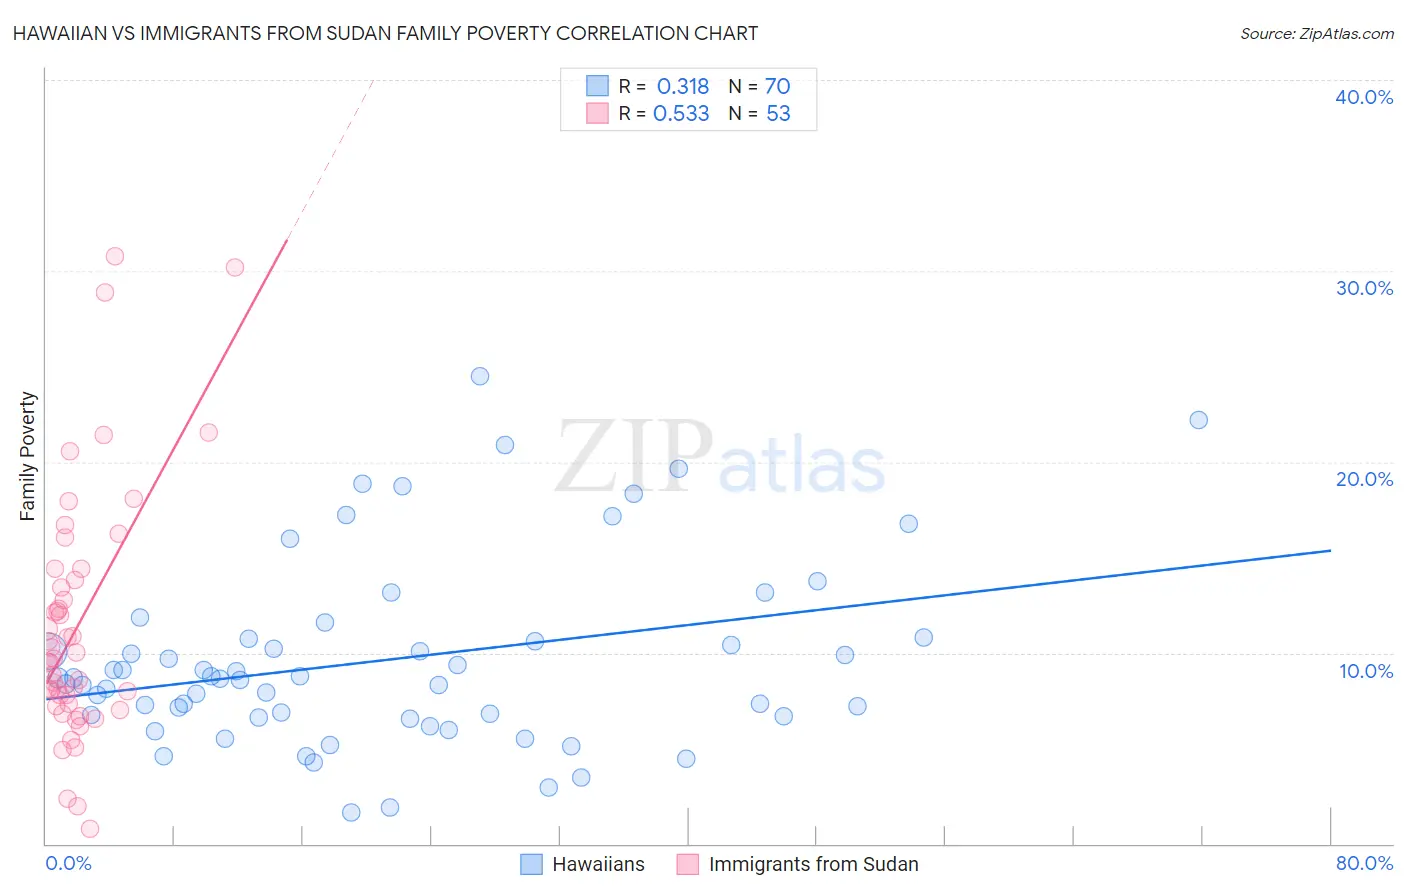
Hawaiian vs Immigrants from Sudan Family Poverty Correlation Chart
The statistical analysis conducted on geographies consisting of 327,007,125 people shows a mild positive correlation between the proportion of Hawaiians and poverty level among families in the United States with a correlation coefficient (R) of 0.318 and weighted average of 9.0%. Similarly, the statistical analysis conducted on geographies consisting of 118,923,711 people shows a substantial positive correlation between the proportion of Immigrants from Sudan and poverty level among families in the United States with a correlation coefficient (R) of 0.533 and weighted average of 10.1%, a difference of 11.8%.
Family Poverty Correlation Summary
| Measurement | Hawaiian | Immigrants from Sudan |
| Minimum | 1.6% | 0.80% |
| Maximum | 24.5% | 30.8% |
| Range | 22.9% | 30.0% |
| Mean | 9.6% | 11.4% |
| Median | 8.7% | 9.7% |
| Interquartile 25% (IQ1) | 6.7% | 7.3% |
| Interquartile 75% (IQ3) | 10.8% | 14.1% |
| Interquartile Range (IQR) | 4.1% | 6.9% |
| Standard Deviation (Sample) | 4.9% | 6.5% |
| Standard Deviation (Population) | 4.8% | 6.4% |
Similar Demographics by Family Poverty
Demographics Similar to Hawaiians by Family Poverty
In terms of family poverty, the demographic groups most similar to Hawaiians are Immigrants from Cameroon (9.0%, a difference of 0.010%), Immigrants from Syria (9.0%, a difference of 0.030%), Costa Rican (9.0%, a difference of 0.27%), Immigrants from Albania (9.0%, a difference of 0.36%), and Immigrants from Iraq (9.1%, a difference of 0.38%).
| Demographics | Rating | Rank | Family Poverty |
| Kenyans | 58.2 /100 | #170 | Average 8.9% |
| Lebanese | 57.6 /100 | #171 | Average 8.9% |
| Immigrants | Peru | 57.5 /100 | #172 | Average 8.9% |
| Immigrants | Fiji | 56.4 /100 | #173 | Average 8.9% |
| Immigrants | Albania | 50.0 /100 | #174 | Average 9.0% |
| Costa Ricans | 49.3 /100 | #175 | Average 9.0% |
| Immigrants | Syria | 47.5 /100 | #176 | Average 9.0% |
| Hawaiians | 47.2 /100 | #177 | Average 9.0% |
| Immigrants | Cameroon | 47.1 /100 | #178 | Average 9.0% |
| Immigrants | Iraq | 44.4 /100 | #179 | Average 9.1% |
| Immigrants | Uganda | 43.4 /100 | #180 | Average 9.1% |
| Hmong | 40.2 /100 | #181 | Average 9.1% |
| Immigrants | Morocco | 40.2 /100 | #182 | Average 9.1% |
| Uruguayans | 39.2 /100 | #183 | Fair 9.1% |
| South American Indians | 38.7 /100 | #184 | Fair 9.1% |
Demographics Similar to Immigrants from Sudan by Family Poverty
In terms of family poverty, the demographic groups most similar to Immigrants from Sudan are Fijian (10.1%, a difference of 0.25%), Immigrants from Middle Africa (10.1%, a difference of 0.36%), Nigerian (10.1%, a difference of 0.39%), Alaskan Athabascan (10.1%, a difference of 0.43%), and Immigrants from Nigeria (10.2%, a difference of 0.64%).
| Demographics | Rating | Rank | Family Poverty |
| Immigrants | Immigrants | 3.6 /100 | #225 | Tragic 10.0% |
| Ottawa | 3.3 /100 | #226 | Tragic 10.0% |
| Immigrants | Armenia | 3.3 /100 | #227 | Tragic 10.0% |
| Sudanese | 3.1 /100 | #228 | Tragic 10.0% |
| Immigrants | Uzbekistan | 3.1 /100 | #229 | Tragic 10.0% |
| Immigrants | Panama | 3.1 /100 | #230 | Tragic 10.0% |
| Alaskan Athabascans | 2.7 /100 | #231 | Tragic 10.1% |
| Immigrants | Sudan | 2.3 /100 | #232 | Tragic 10.1% |
| Fijians | 2.1 /100 | #233 | Tragic 10.1% |
| Immigrants | Middle Africa | 2.1 /100 | #234 | Tragic 10.1% |
| Nigerians | 2.0 /100 | #235 | Tragic 10.1% |
| Immigrants | Nigeria | 1.9 /100 | #236 | Tragic 10.2% |
| Immigrants | Laos | 1.7 /100 | #237 | Tragic 10.2% |
| French American Indians | 1.5 /100 | #238 | Tragic 10.2% |
| Potawatomi | 1.5 /100 | #239 | Tragic 10.2% |