Immigrants from Brazil vs Immigrants from Sudan Births to Unmarried Women
COMPARE
Immigrants from Brazil
Immigrants from Sudan
Births to Unmarried Women
Births to Unmarried Women Comparison
Immigrants from Brazil
Immigrants from Sudan
29.6%
BIRTHS TO UNMARRIED WOMEN
93.7/ 100
METRIC RATING
107th/ 347
METRIC RANK
33.2%
BIRTHS TO UNMARRIED WOMEN
11.5/ 100
METRIC RATING
207th/ 347
METRIC RANK
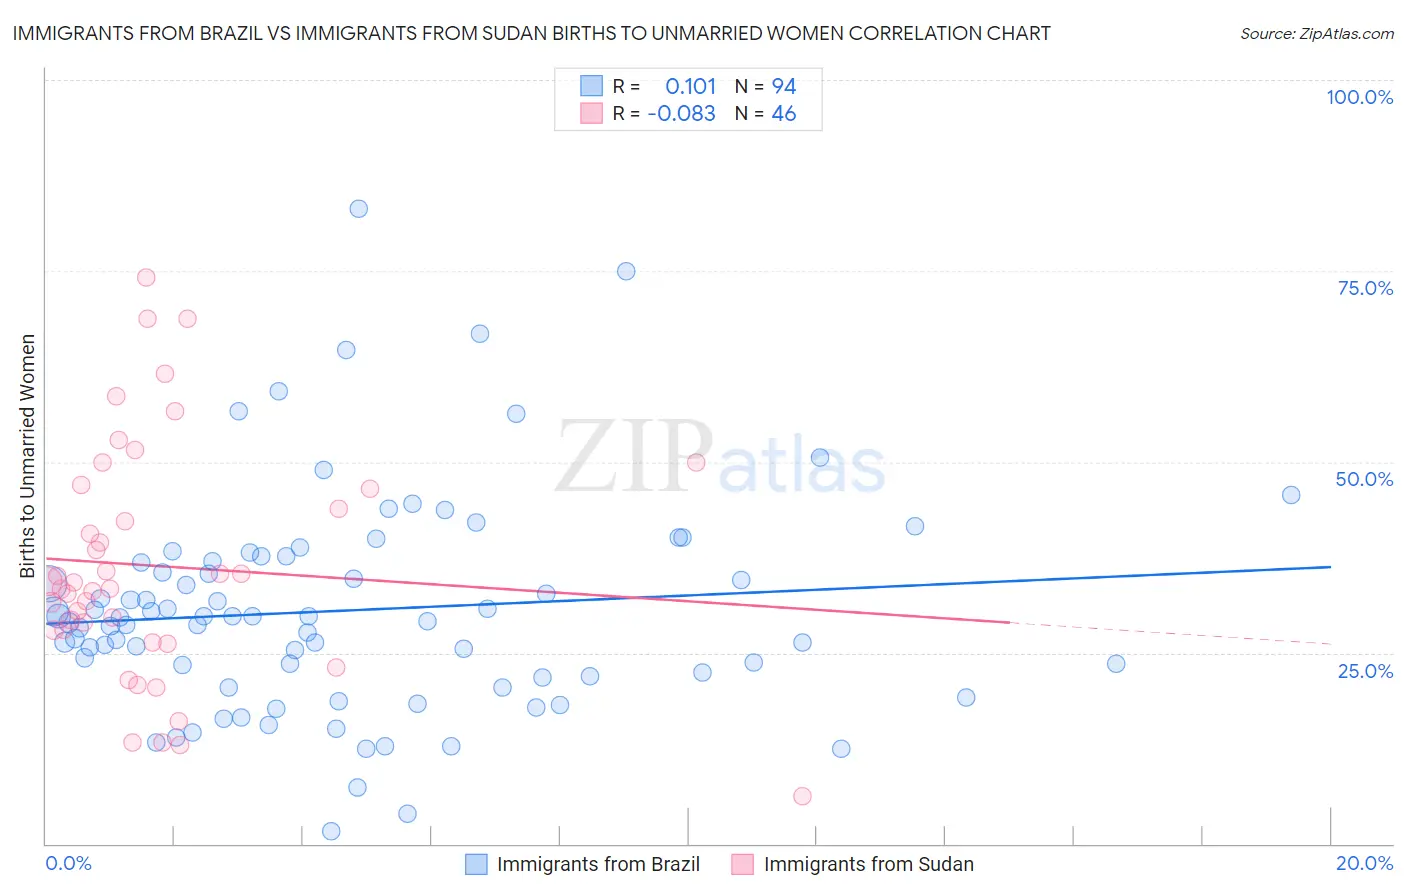
Immigrants from Brazil vs Immigrants from Sudan Births to Unmarried Women Correlation Chart
The statistical analysis conducted on geographies consisting of 321,610,607 people shows a poor positive correlation between the proportion of Immigrants from Brazil and percentage of births to unmarried women in the United States with a correlation coefficient (R) of 0.101 and weighted average of 29.6%. Similarly, the statistical analysis conducted on geographies consisting of 116,444,182 people shows a slight negative correlation between the proportion of Immigrants from Sudan and percentage of births to unmarried women in the United States with a correlation coefficient (R) of -0.083 and weighted average of 33.2%, a difference of 12.0%.
Births to Unmarried Women Correlation Summary
| Measurement | Immigrants from Brazil | Immigrants from Sudan |
| Minimum | 1.6% | 6.3% |
| Maximum | 83.2% | 74.2% |
| Range | 81.6% | 67.9% |
| Mean | 30.6% | 36.3% |
| Median | 29.4% | 33.8% |
| Interquartile 25% (IQ1) | 22.0% | 28.0% |
| Interquartile 75% (IQ3) | 36.9% | 46.4% |
| Interquartile Range (IQR) | 14.9% | 18.4% |
| Standard Deviation (Sample) | 14.2% | 15.4% |
| Standard Deviation (Population) | 14.1% | 15.3% |
Similar Demographics by Births to Unmarried Women
Demographics Similar to Immigrants from Brazil by Births to Unmarried Women
In terms of births to unmarried women, the demographic groups most similar to Immigrants from Brazil are Swedish (29.6%, a difference of 0.010%), Paraguayan (29.7%, a difference of 0.090%), Greek (29.7%, a difference of 0.12%), Immigrants from Ethiopia (29.7%, a difference of 0.15%), and Immigrants from Nepal (29.6%, a difference of 0.27%).
| Demographics | Rating | Rank | Births to Unmarried Women |
| Luxembourgers | 95.2 /100 | #100 | Exceptional 29.4% |
| Immigrants | Northern Africa | 94.7 /100 | #101 | Exceptional 29.5% |
| Australians | 94.6 /100 | #102 | Exceptional 29.5% |
| Lebanese | 94.4 /100 | #103 | Exceptional 29.5% |
| Lithuanians | 94.4 /100 | #104 | Exceptional 29.6% |
| Immigrants | Nepal | 94.3 /100 | #105 | Exceptional 29.6% |
| Swedes | 93.8 /100 | #106 | Exceptional 29.6% |
| Immigrants | Brazil | 93.7 /100 | #107 | Exceptional 29.6% |
| Paraguayans | 93.5 /100 | #108 | Exceptional 29.7% |
| Greeks | 93.4 /100 | #109 | Exceptional 29.7% |
| Immigrants | Ethiopia | 93.4 /100 | #110 | Exceptional 29.7% |
| Immigrants | Hungary | 93.0 /100 | #111 | Exceptional 29.7% |
| Basques | 93.0 /100 | #112 | Exceptional 29.7% |
| Scandinavians | 92.7 /100 | #113 | Exceptional 29.8% |
| Immigrants | Croatia | 92.6 /100 | #114 | Exceptional 29.8% |
Demographics Similar to Immigrants from Sudan by Births to Unmarried Women
In terms of births to unmarried women, the demographic groups most similar to Immigrants from Sudan are Hawaiian (33.2%, a difference of 0.030%), White/Caucasian (33.3%, a difference of 0.17%), Scotch-Irish (33.3%, a difference of 0.17%), Ecuadorian (33.3%, a difference of 0.22%), and Uruguayan (33.1%, a difference of 0.29%).
| Demographics | Rating | Rank | Births to Unmarried Women |
| Immigrants | Germany | 18.8 /100 | #200 | Poor 32.8% |
| Immigrants | Burma/Myanmar | 16.7 /100 | #201 | Poor 32.9% |
| Immigrants | Micronesia | 16.6 /100 | #202 | Poor 32.9% |
| Ute | 14.4 /100 | #203 | Poor 33.0% |
| Immigrants | Africa | 14.3 /100 | #204 | Poor 33.0% |
| German Russians | 13.1 /100 | #205 | Poor 33.1% |
| Uruguayans | 12.8 /100 | #206 | Poor 33.1% |
| Immigrants | Sudan | 11.5 /100 | #207 | Poor 33.2% |
| Hawaiians | 11.3 /100 | #208 | Poor 33.2% |
| Whites/Caucasians | 10.7 /100 | #209 | Poor 33.3% |
| Scotch-Irish | 10.7 /100 | #210 | Poor 33.3% |
| Ecuadorians | 10.5 /100 | #211 | Poor 33.3% |
| Celtics | 10.2 /100 | #212 | Poor 33.3% |
| Immigrants | Costa Rica | 9.5 /100 | #213 | Tragic 33.4% |
| Slovaks | 9.3 /100 | #214 | Tragic 33.4% |