Delaware vs Immigrants from Sudan Births to Unmarried Women
COMPARE
Delaware
Immigrants from Sudan
Births to Unmarried Women
Births to Unmarried Women Comparison
Delaware
Immigrants from Sudan
34.2%
BIRTHS TO UNMARRIED WOMEN
3.3/ 100
METRIC RATING
226th/ 347
METRIC RANK
33.2%
BIRTHS TO UNMARRIED WOMEN
11.5/ 100
METRIC RATING
207th/ 347
METRIC RANK
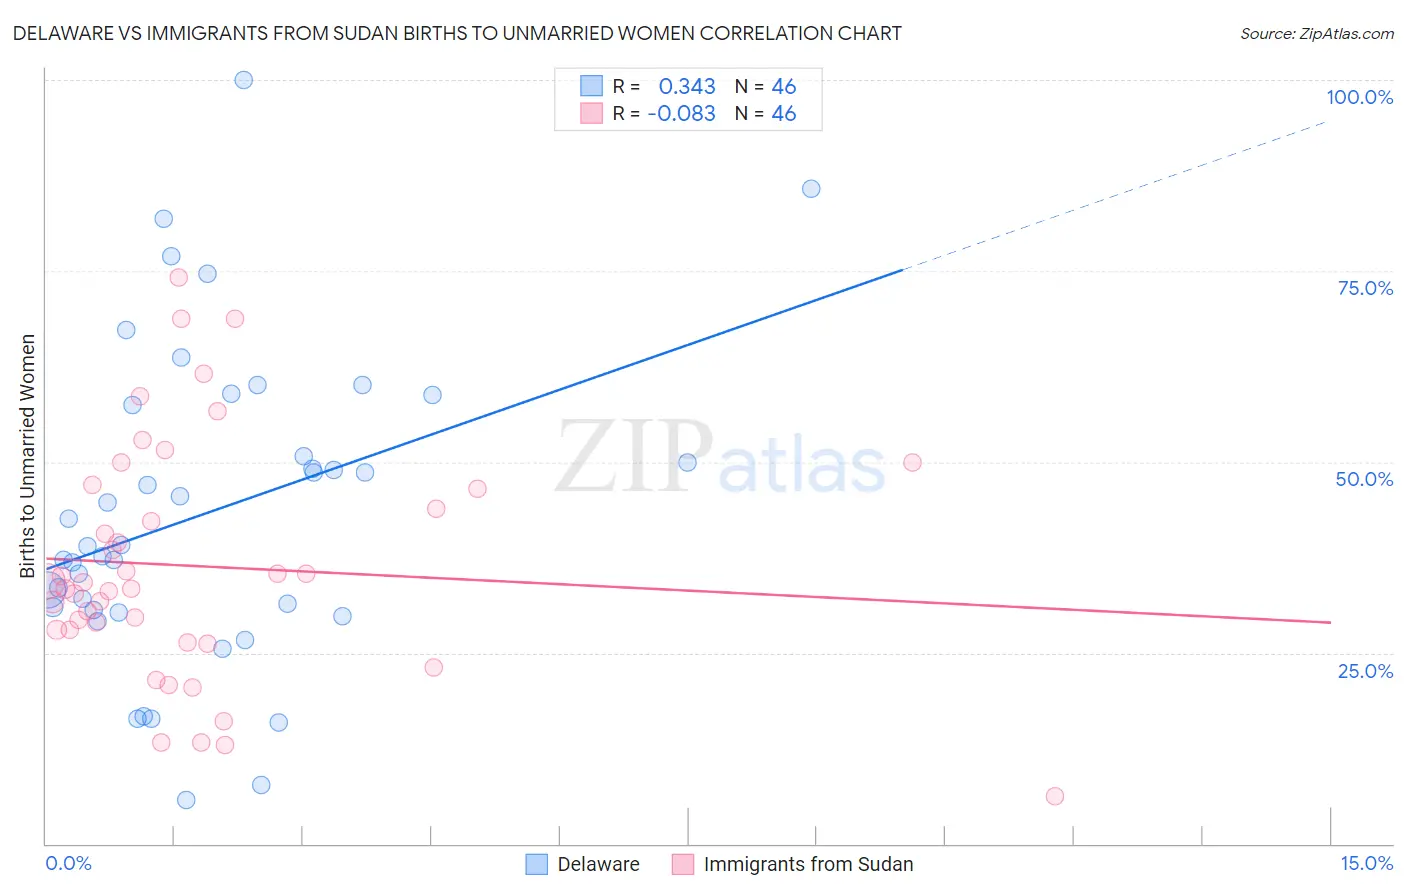
Delaware vs Immigrants from Sudan Births to Unmarried Women Correlation Chart
The statistical analysis conducted on geographies consisting of 93,888,515 people shows a mild positive correlation between the proportion of Delaware and percentage of births to unmarried women in the United States with a correlation coefficient (R) of 0.343 and weighted average of 34.2%. Similarly, the statistical analysis conducted on geographies consisting of 116,444,182 people shows a slight negative correlation between the proportion of Immigrants from Sudan and percentage of births to unmarried women in the United States with a correlation coefficient (R) of -0.083 and weighted average of 33.2%, a difference of 3.0%.
Births to Unmarried Women Correlation Summary
| Measurement | Delaware | Immigrants from Sudan |
| Minimum | 5.8% | 6.3% |
| Maximum | 100.0% | 74.2% |
| Range | 94.2% | 67.9% |
| Mean | 43.4% | 36.3% |
| Median | 39.0% | 33.8% |
| Interquartile 25% (IQ1) | 30.6% | 28.0% |
| Interquartile 75% (IQ3) | 57.4% | 46.4% |
| Interquartile Range (IQR) | 26.8% | 18.4% |
| Standard Deviation (Sample) | 20.5% | 15.4% |
| Standard Deviation (Population) | 20.2% | 15.3% |
Demographics Similar to Delaware and Immigrants from Sudan by Births to Unmarried Women
In terms of births to unmarried women, the demographic groups most similar to Delaware are Spanish (34.1%, a difference of 0.39%), Pennsylvania German (34.0%, a difference of 0.56%), Immigrants from Laos (34.0%, a difference of 0.56%), Immigrants from Uruguay (33.9%, a difference of 0.85%), and Malaysian (33.9%, a difference of 0.92%). Similarly, the demographic groups most similar to Immigrants from Sudan are Hawaiian (33.2%, a difference of 0.030%), White/Caucasian (33.3%, a difference of 0.17%), Scotch-Irish (33.3%, a difference of 0.17%), Ecuadorian (33.3%, a difference of 0.22%), and Uruguayan (33.1%, a difference of 0.29%).
| Demographics | Rating | Rank | Births to Unmarried Women |
| Uruguayans | 12.8 /100 | #206 | Poor 33.1% |
| Immigrants | Sudan | 11.5 /100 | #207 | Poor 33.2% |
| Hawaiians | 11.3 /100 | #208 | Poor 33.2% |
| Whites/Caucasians | 10.7 /100 | #209 | Poor 33.3% |
| Scotch-Irish | 10.7 /100 | #210 | Poor 33.3% |
| Ecuadorians | 10.5 /100 | #211 | Poor 33.3% |
| Celtics | 10.2 /100 | #212 | Poor 33.3% |
| Immigrants | Costa Rica | 9.5 /100 | #213 | Tragic 33.4% |
| Slovaks | 9.3 /100 | #214 | Tragic 33.4% |
| French | 8.7 /100 | #215 | Tragic 33.4% |
| Nepalese | 7.8 /100 | #216 | Tragic 33.5% |
| Spaniards | 7.0 /100 | #217 | Tragic 33.6% |
| Immigrants | Ecuador | 5.9 /100 | #218 | Tragic 33.7% |
| Alsatians | 5.4 /100 | #219 | Tragic 33.8% |
| Portuguese | 5.4 /100 | #220 | Tragic 33.8% |
| Malaysians | 5.0 /100 | #221 | Tragic 33.9% |
| Immigrants | Uruguay | 4.8 /100 | #222 | Tragic 33.9% |
| Pennsylvania Germans | 4.3 /100 | #223 | Tragic 34.0% |
| Immigrants | Laos | 4.3 /100 | #224 | Tragic 34.0% |
| Spanish | 4.0 /100 | #225 | Tragic 34.1% |
| Delaware | 3.3 /100 | #226 | Tragic 34.2% |