Hawaiian vs Tohono O'odham Births to Unmarried Women
COMPARE
Hawaiian
Tohono O'odham
Births to Unmarried Women
Births to Unmarried Women Comparison
Hawaiians
Tohono O'odham
33.2%
BIRTHS TO UNMARRIED WOMEN
11.3/ 100
METRIC RATING
208th/ 347
METRIC RANK
49.8%
BIRTHS TO UNMARRIED WOMEN
0.0/ 100
METRIC RATING
340th/ 347
METRIC RANK
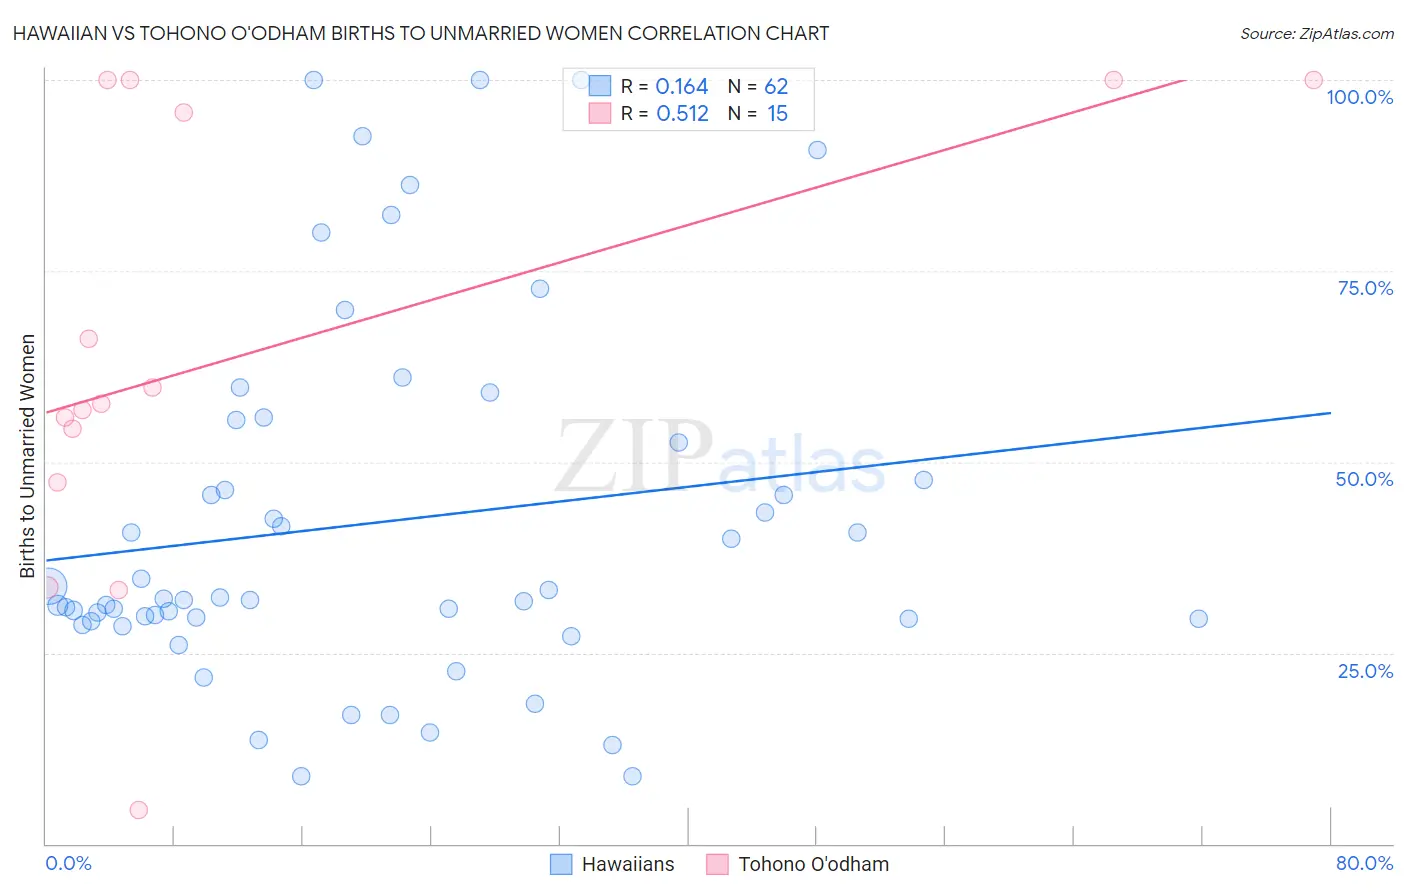
Hawaiian vs Tohono O'odham Births to Unmarried Women Correlation Chart
The statistical analysis conducted on geographies consisting of 312,224,673 people shows a poor positive correlation between the proportion of Hawaiians and percentage of births to unmarried women in the United States with a correlation coefficient (R) of 0.164 and weighted average of 33.2%. Similarly, the statistical analysis conducted on geographies consisting of 58,143,081 people shows a substantial positive correlation between the proportion of Tohono O'odham and percentage of births to unmarried women in the United States with a correlation coefficient (R) of 0.512 and weighted average of 49.8%, a difference of 50.1%.
Births to Unmarried Women Correlation Summary
| Measurement | Hawaiian | Tohono O'odham |
| Minimum | 8.9% | 4.5% |
| Maximum | 100.0% | 100.0% |
| Range | 91.1% | 95.5% |
| Mean | 42.0% | 64.3% |
| Median | 31.9% | 57.6% |
| Interquartile 25% (IQ1) | 29.4% | 47.3% |
| Interquartile 75% (IQ3) | 52.6% | 100.0% |
| Interquartile Range (IQR) | 23.2% | 52.7% |
| Standard Deviation (Sample) | 23.6% | 29.5% |
| Standard Deviation (Population) | 23.4% | 28.5% |
Similar Demographics by Births to Unmarried Women
Demographics Similar to Hawaiians by Births to Unmarried Women
In terms of births to unmarried women, the demographic groups most similar to Hawaiians are Immigrants from Sudan (33.2%, a difference of 0.030%), White/Caucasian (33.3%, a difference of 0.14%), Scotch-Irish (33.3%, a difference of 0.14%), Ecuadorian (33.3%, a difference of 0.19%), and Celtic (33.3%, a difference of 0.25%).
| Demographics | Rating | Rank | Births to Unmarried Women |
| Immigrants | Burma/Myanmar | 16.7 /100 | #201 | Poor 32.9% |
| Immigrants | Micronesia | 16.6 /100 | #202 | Poor 32.9% |
| Ute | 14.4 /100 | #203 | Poor 33.0% |
| Immigrants | Africa | 14.3 /100 | #204 | Poor 33.0% |
| German Russians | 13.1 /100 | #205 | Poor 33.1% |
| Uruguayans | 12.8 /100 | #206 | Poor 33.1% |
| Immigrants | Sudan | 11.5 /100 | #207 | Poor 33.2% |
| Hawaiians | 11.3 /100 | #208 | Poor 33.2% |
| Whites/Caucasians | 10.7 /100 | #209 | Poor 33.3% |
| Scotch-Irish | 10.7 /100 | #210 | Poor 33.3% |
| Ecuadorians | 10.5 /100 | #211 | Poor 33.3% |
| Celtics | 10.2 /100 | #212 | Poor 33.3% |
| Immigrants | Costa Rica | 9.5 /100 | #213 | Tragic 33.4% |
| Slovaks | 9.3 /100 | #214 | Tragic 33.4% |
| French | 8.7 /100 | #215 | Tragic 33.4% |
Demographics Similar to Tohono O'odham by Births to Unmarried Women
In terms of births to unmarried women, the demographic groups most similar to Tohono O'odham are Hopi (50.8%, a difference of 1.9%), Menominee (51.1%, a difference of 2.5%), Pima (51.5%, a difference of 3.3%), Navajo (51.5%, a difference of 3.3%), and Lumbee (48.2%, a difference of 3.4%).
| Demographics | Rating | Rank | Births to Unmarried Women |
| Blacks/African Americans | 0.0 /100 | #333 | Tragic 44.3% |
| Yuman | 0.0 /100 | #334 | Tragic 44.4% |
| Colville | 0.0 /100 | #335 | Tragic 45.3% |
| Puerto Ricans | 0.0 /100 | #336 | Tragic 45.7% |
| Houma | 0.0 /100 | #337 | Tragic 46.6% |
| Arapaho | 0.0 /100 | #338 | Tragic 47.1% |
| Lumbee | 0.0 /100 | #339 | Tragic 48.2% |
| Tohono O'odham | 0.0 /100 | #340 | Tragic 49.8% |
| Hopi | 0.0 /100 | #341 | Tragic 50.8% |
| Menominee | 0.0 /100 | #342 | Tragic 51.1% |
| Pima | 0.0 /100 | #343 | Tragic 51.5% |
| Navajo | 0.0 /100 | #344 | Tragic 51.5% |
| Inupiat | 0.0 /100 | #345 | Tragic 52.1% |
| Pueblo | 0.0 /100 | #346 | Tragic 53.7% |
| Yup'ik | 0.0 /100 | #347 | Tragic 56.4% |