European vs Immigrants from Sudan Births to Unmarried Women
COMPARE
European
Immigrants from Sudan
Births to Unmarried Women
Births to Unmarried Women Comparison
Europeans
Immigrants from Sudan
30.2%
BIRTHS TO UNMARRIED WOMEN
87.2/ 100
METRIC RATING
126th/ 347
METRIC RANK
33.2%
BIRTHS TO UNMARRIED WOMEN
11.5/ 100
METRIC RATING
207th/ 347
METRIC RANK
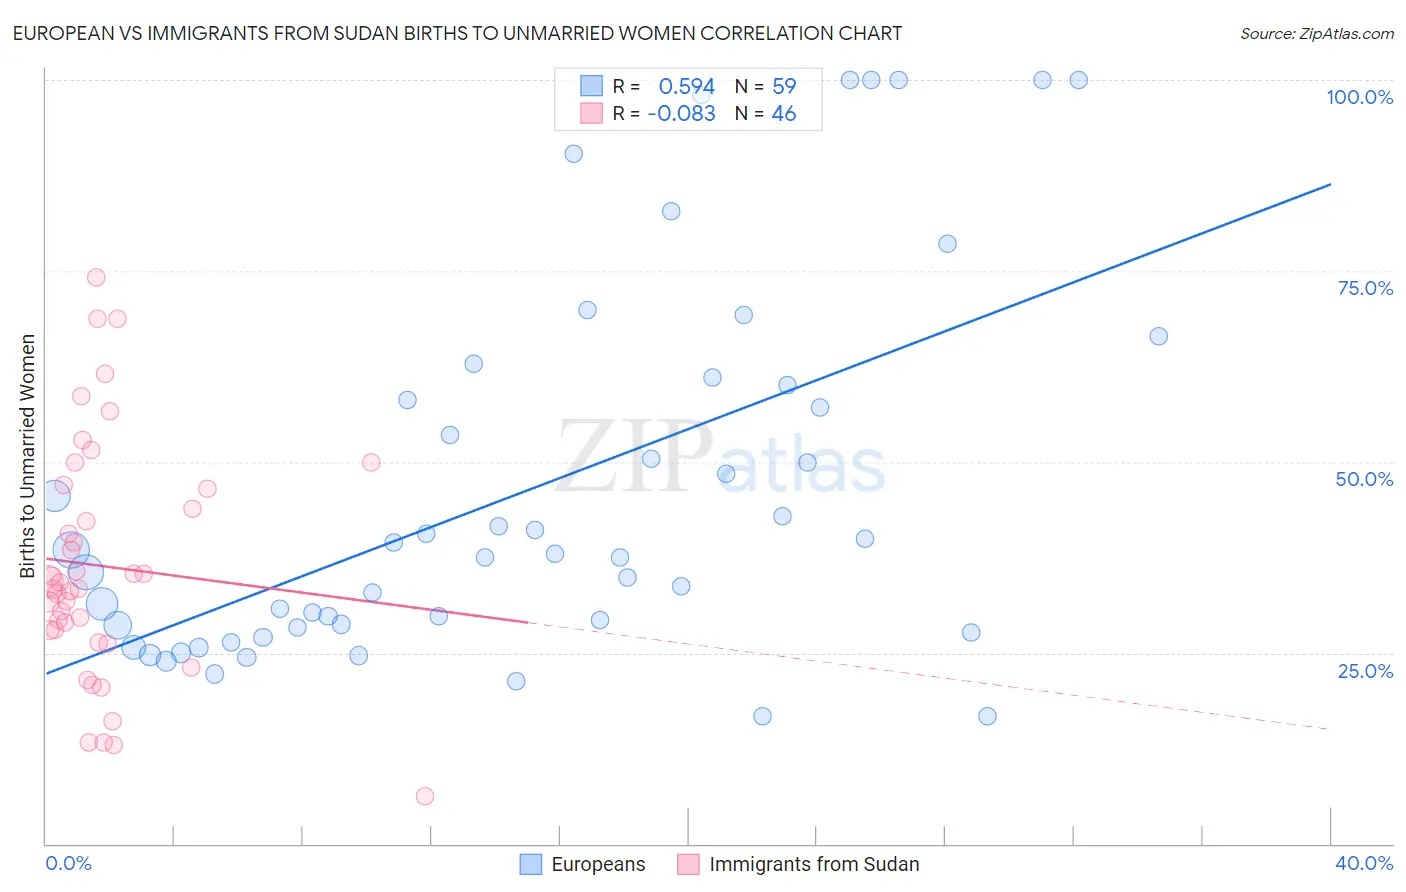
European vs Immigrants from Sudan Births to Unmarried Women Correlation Chart
The statistical analysis conducted on geographies consisting of 499,777,357 people shows a substantial positive correlation between the proportion of Europeans and percentage of births to unmarried women in the United States with a correlation coefficient (R) of 0.594 and weighted average of 30.2%. Similarly, the statistical analysis conducted on geographies consisting of 116,444,182 people shows a slight negative correlation between the proportion of Immigrants from Sudan and percentage of births to unmarried women in the United States with a correlation coefficient (R) of -0.083 and weighted average of 33.2%, a difference of 9.8%.
Births to Unmarried Women Correlation Summary
| Measurement | European | Immigrants from Sudan |
| Minimum | 16.7% | 6.3% |
| Maximum | 100.0% | 74.2% |
| Range | 83.3% | 67.9% |
| Mean | 46.4% | 36.3% |
| Median | 38.0% | 33.8% |
| Interquartile 25% (IQ1) | 28.3% | 28.0% |
| Interquartile 75% (IQ3) | 60.0% | 46.4% |
| Interquartile Range (IQR) | 31.7% | 18.4% |
| Standard Deviation (Sample) | 24.5% | 15.4% |
| Standard Deviation (Population) | 24.3% | 15.3% |
Similar Demographics by Births to Unmarried Women
Demographics Similar to Europeans by Births to Unmarried Women
In terms of births to unmarried women, the demographic groups most similar to Europeans are Chinese (30.2%, a difference of 0.030%), Vietnamese (30.2%, a difference of 0.12%), Croatian (30.2%, a difference of 0.19%), Syrian (30.2%, a difference of 0.23%), and Icelander (30.3%, a difference of 0.27%).
| Demographics | Rating | Rank | Births to Unmarried Women |
| Argentineans | 90.5 /100 | #119 | Exceptional 30.0% |
| Ugandans | 89.2 /100 | #120 | Excellent 30.1% |
| Koreans | 88.9 /100 | #121 | Excellent 30.1% |
| Immigrants | Argentina | 88.7 /100 | #122 | Excellent 30.1% |
| Syrians | 88.2 /100 | #123 | Excellent 30.2% |
| Croatians | 88.0 /100 | #124 | Excellent 30.2% |
| Vietnamese | 87.7 /100 | #125 | Excellent 30.2% |
| Europeans | 87.2 /100 | #126 | Excellent 30.2% |
| Chinese | 87.1 /100 | #127 | Excellent 30.2% |
| Icelanders | 86.0 /100 | #128 | Excellent 30.3% |
| Immigrants | Spain | 85.8 /100 | #129 | Excellent 30.3% |
| Immigrants | Bosnia and Herzegovina | 85.7 /100 | #130 | Excellent 30.3% |
| Immigrants | Zimbabwe | 85.7 /100 | #131 | Excellent 30.3% |
| New Zealanders | 85.5 /100 | #132 | Excellent 30.3% |
| Immigrants | Morocco | 85.2 /100 | #133 | Excellent 30.4% |
Demographics Similar to Immigrants from Sudan by Births to Unmarried Women
In terms of births to unmarried women, the demographic groups most similar to Immigrants from Sudan are Hawaiian (33.2%, a difference of 0.030%), White/Caucasian (33.3%, a difference of 0.17%), Scotch-Irish (33.3%, a difference of 0.17%), Ecuadorian (33.3%, a difference of 0.22%), and Uruguayan (33.1%, a difference of 0.29%).
| Demographics | Rating | Rank | Births to Unmarried Women |
| Immigrants | Germany | 18.8 /100 | #200 | Poor 32.8% |
| Immigrants | Burma/Myanmar | 16.7 /100 | #201 | Poor 32.9% |
| Immigrants | Micronesia | 16.6 /100 | #202 | Poor 32.9% |
| Ute | 14.4 /100 | #203 | Poor 33.0% |
| Immigrants | Africa | 14.3 /100 | #204 | Poor 33.0% |
| German Russians | 13.1 /100 | #205 | Poor 33.1% |
| Uruguayans | 12.8 /100 | #206 | Poor 33.1% |
| Immigrants | Sudan | 11.5 /100 | #207 | Poor 33.2% |
| Hawaiians | 11.3 /100 | #208 | Poor 33.2% |
| Whites/Caucasians | 10.7 /100 | #209 | Poor 33.3% |
| Scotch-Irish | 10.7 /100 | #210 | Poor 33.3% |
| Ecuadorians | 10.5 /100 | #211 | Poor 33.3% |
| Celtics | 10.2 /100 | #212 | Poor 33.3% |
| Immigrants | Costa Rica | 9.5 /100 | #213 | Tragic 33.4% |
| Slovaks | 9.3 /100 | #214 | Tragic 33.4% |