Hawaiian vs Immigrants from Sudan GED/Equivalency
COMPARE
Hawaiian
Immigrants from Sudan
GED/Equivalency
GED/Equivalency Comparison
Hawaiians
Immigrants from Sudan
85.0%
GED/EQUIVALENCY
15.2/ 100
METRIC RATING
204th/ 347
METRIC RANK
85.5%
GED/EQUIVALENCY
34.2/ 100
METRIC RATING
183rd/ 347
METRIC RANK
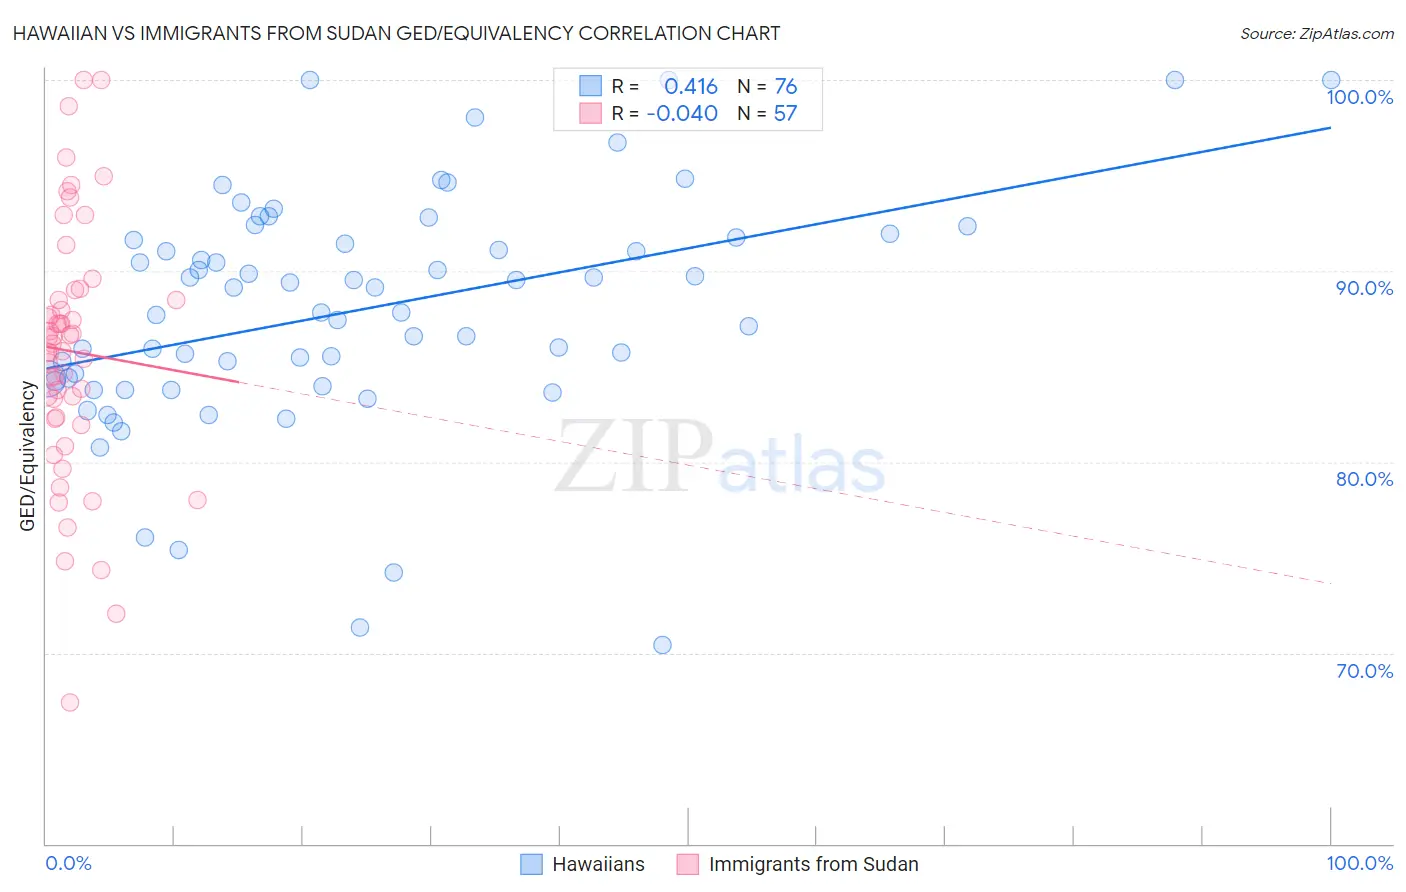
Hawaiian vs Immigrants from Sudan GED/Equivalency Correlation Chart
The statistical analysis conducted on geographies consisting of 327,620,955 people shows a moderate positive correlation between the proportion of Hawaiians and percentage of population with at least ged/equivalency education in the United States with a correlation coefficient (R) of 0.416 and weighted average of 85.0%. Similarly, the statistical analysis conducted on geographies consisting of 118,959,807 people shows no correlation between the proportion of Immigrants from Sudan and percentage of population with at least ged/equivalency education in the United States with a correlation coefficient (R) of -0.040 and weighted average of 85.5%, a difference of 0.55%.
GED/Equivalency Correlation Summary
| Measurement | Hawaiian | Immigrants from Sudan |
| Minimum | 70.4% | 67.4% |
| Maximum | 100.0% | 100.0% |
| Range | 29.6% | 32.6% |
| Mean | 87.9% | 85.8% |
| Median | 88.5% | 86.2% |
| Interquartile 25% (IQ1) | 84.3% | 82.3% |
| Interquartile 75% (IQ3) | 91.7% | 88.7% |
| Interquartile Range (IQR) | 7.4% | 6.4% |
| Standard Deviation (Sample) | 6.1% | 6.6% |
| Standard Deviation (Population) | 6.0% | 6.5% |
Similar Demographics by GED/Equivalency
Demographics Similar to Hawaiians by GED/Equivalency
In terms of ged/equivalency, the demographic groups most similar to Hawaiians are Panamanian (85.0%, a difference of 0.0%), Uruguayan (85.0%, a difference of 0.030%), Portuguese (85.0%, a difference of 0.030%), Cree (85.0%, a difference of 0.030%), and Liberian (85.0%, a difference of 0.030%).
| Demographics | Rating | Rank | GED/Equivalency |
| Costa Ricans | 20.4 /100 | #197 | Fair 85.2% |
| Immigrants | Africa | 17.5 /100 | #198 | Poor 85.1% |
| Somalis | 16.4 /100 | #199 | Poor 85.0% |
| Uruguayans | 16.0 /100 | #200 | Poor 85.0% |
| Portuguese | 15.9 /100 | #201 | Poor 85.0% |
| Cree | 15.9 /100 | #202 | Poor 85.0% |
| Panamanians | 15.3 /100 | #203 | Poor 85.0% |
| Hawaiians | 15.2 /100 | #204 | Poor 85.0% |
| Liberians | 14.6 /100 | #205 | Poor 85.0% |
| Samoans | 13.7 /100 | #206 | Poor 84.9% |
| Hmong | 13.1 /100 | #207 | Poor 84.9% |
| Marshallese | 12.5 /100 | #208 | Poor 84.9% |
| Colombians | 12.3 /100 | #209 | Poor 84.9% |
| Immigrants | Cameroon | 12.1 /100 | #210 | Poor 84.9% |
| South Americans | 10.9 /100 | #211 | Poor 84.8% |
Demographics Similar to Immigrants from Sudan by GED/Equivalency
In terms of ged/equivalency, the demographic groups most similar to Immigrants from Sudan are Immigrants from Oceania (85.5%, a difference of 0.010%), Sudanese (85.5%, a difference of 0.020%), Spanish (85.4%, a difference of 0.030%), Spaniard (85.4%, a difference of 0.050%), and Moroccan (85.5%, a difference of 0.080%).
| Demographics | Rating | Rank | GED/Equivalency |
| Immigrants | Eastern Africa | 47.7 /100 | #176 | Average 85.7% |
| Immigrants | Uganda | 45.2 /100 | #177 | Average 85.7% |
| Koreans | 41.2 /100 | #178 | Average 85.6% |
| Aleuts | 40.5 /100 | #179 | Average 85.6% |
| Immigrants | Southern Europe | 38.4 /100 | #180 | Fair 85.5% |
| Moroccans | 37.7 /100 | #181 | Fair 85.5% |
| Sudanese | 35.2 /100 | #182 | Fair 85.5% |
| Immigrants | Sudan | 34.2 /100 | #183 | Fair 85.5% |
| Immigrants | Oceania | 33.6 /100 | #184 | Fair 85.5% |
| Spanish | 32.8 /100 | #185 | Fair 85.4% |
| Spaniards | 31.9 /100 | #186 | Fair 85.4% |
| Immigrants | Afghanistan | 29.8 /100 | #187 | Fair 85.4% |
| Immigrants | Sierra Leone | 29.0 /100 | #188 | Fair 85.4% |
| Guamanians/Chamorros | 28.4 /100 | #189 | Fair 85.3% |
| Alaskan Athabascans | 27.5 /100 | #190 | Fair 85.3% |