Hawaiian vs Immigrants from Spain Births to Unmarried Women
COMPARE
Hawaiian
Immigrants from Spain
Births to Unmarried Women
Births to Unmarried Women Comparison
Hawaiians
Immigrants from Spain
33.2%
BIRTHS TO UNMARRIED WOMEN
11.3/ 100
METRIC RATING
208th/ 347
METRIC RANK
30.3%
BIRTHS TO UNMARRIED WOMEN
85.8/ 100
METRIC RATING
129th/ 347
METRIC RANK
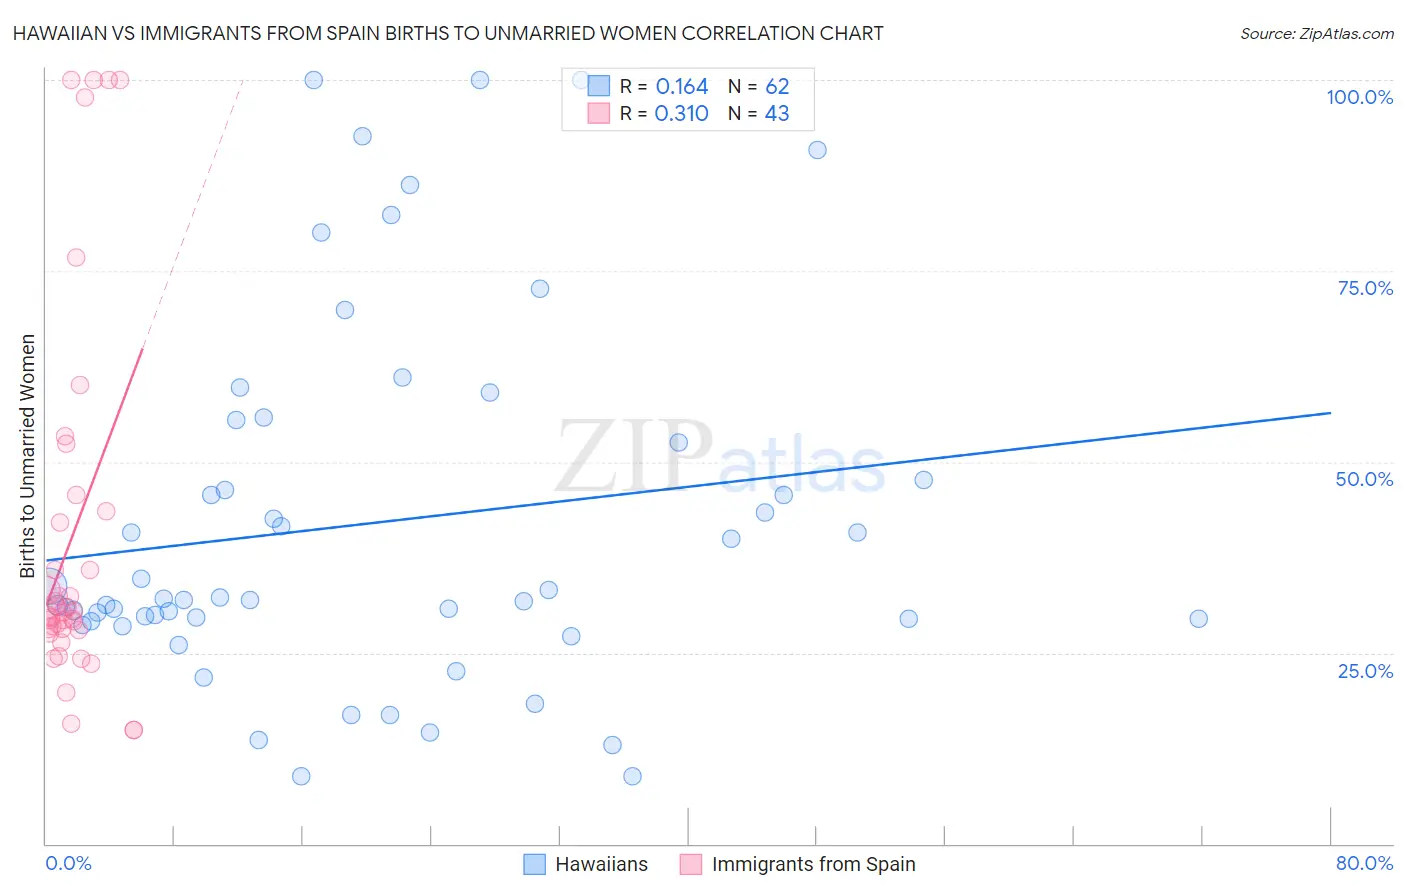
Hawaiian vs Immigrants from Spain Births to Unmarried Women Correlation Chart
The statistical analysis conducted on geographies consisting of 312,224,673 people shows a poor positive correlation between the proportion of Hawaiians and percentage of births to unmarried women in the United States with a correlation coefficient (R) of 0.164 and weighted average of 33.2%. Similarly, the statistical analysis conducted on geographies consisting of 227,898,948 people shows a mild positive correlation between the proportion of Immigrants from Spain and percentage of births to unmarried women in the United States with a correlation coefficient (R) of 0.310 and weighted average of 30.3%, a difference of 9.5%.
Births to Unmarried Women Correlation Summary
| Measurement | Hawaiian | Immigrants from Spain |
| Minimum | 8.9% | 14.9% |
| Maximum | 100.0% | 100.0% |
| Range | 91.1% | 85.1% |
| Mean | 42.0% | 40.2% |
| Median | 31.9% | 30.3% |
| Interquartile 25% (IQ1) | 29.4% | 28.0% |
| Interquartile 75% (IQ3) | 52.6% | 43.6% |
| Interquartile Range (IQR) | 23.2% | 15.6% |
| Standard Deviation (Sample) | 23.6% | 24.6% |
| Standard Deviation (Population) | 23.4% | 24.3% |
Similar Demographics by Births to Unmarried Women
Demographics Similar to Hawaiians by Births to Unmarried Women
In terms of births to unmarried women, the demographic groups most similar to Hawaiians are Immigrants from Sudan (33.2%, a difference of 0.030%), White/Caucasian (33.3%, a difference of 0.14%), Scotch-Irish (33.3%, a difference of 0.14%), Ecuadorian (33.3%, a difference of 0.19%), and Celtic (33.3%, a difference of 0.25%).
| Demographics | Rating | Rank | Births to Unmarried Women |
| Immigrants | Burma/Myanmar | 16.7 /100 | #201 | Poor 32.9% |
| Immigrants | Micronesia | 16.6 /100 | #202 | Poor 32.9% |
| Ute | 14.4 /100 | #203 | Poor 33.0% |
| Immigrants | Africa | 14.3 /100 | #204 | Poor 33.0% |
| German Russians | 13.1 /100 | #205 | Poor 33.1% |
| Uruguayans | 12.8 /100 | #206 | Poor 33.1% |
| Immigrants | Sudan | 11.5 /100 | #207 | Poor 33.2% |
| Hawaiians | 11.3 /100 | #208 | Poor 33.2% |
| Whites/Caucasians | 10.7 /100 | #209 | Poor 33.3% |
| Scotch-Irish | 10.7 /100 | #210 | Poor 33.3% |
| Ecuadorians | 10.5 /100 | #211 | Poor 33.3% |
| Celtics | 10.2 /100 | #212 | Poor 33.3% |
| Immigrants | Costa Rica | 9.5 /100 | #213 | Tragic 33.4% |
| Slovaks | 9.3 /100 | #214 | Tragic 33.4% |
| French | 8.7 /100 | #215 | Tragic 33.4% |
Demographics Similar to Immigrants from Spain by Births to Unmarried Women
In terms of births to unmarried women, the demographic groups most similar to Immigrants from Spain are Immigrants from Bosnia and Herzegovina (30.3%, a difference of 0.010%), Immigrants from Zimbabwe (30.3%, a difference of 0.020%), Icelander (30.3%, a difference of 0.040%), New Zealander (30.3%, a difference of 0.060%), and Immigrants from Morocco (30.4%, a difference of 0.11%).
| Demographics | Rating | Rank | Births to Unmarried Women |
| Immigrants | Argentina | 88.7 /100 | #122 | Excellent 30.1% |
| Syrians | 88.2 /100 | #123 | Excellent 30.2% |
| Croatians | 88.0 /100 | #124 | Excellent 30.2% |
| Vietnamese | 87.7 /100 | #125 | Excellent 30.2% |
| Europeans | 87.2 /100 | #126 | Excellent 30.2% |
| Chinese | 87.1 /100 | #127 | Excellent 30.2% |
| Icelanders | 86.0 /100 | #128 | Excellent 30.3% |
| Immigrants | Spain | 85.8 /100 | #129 | Excellent 30.3% |
| Immigrants | Bosnia and Herzegovina | 85.7 /100 | #130 | Excellent 30.3% |
| Immigrants | Zimbabwe | 85.7 /100 | #131 | Excellent 30.3% |
| New Zealanders | 85.5 /100 | #132 | Excellent 30.3% |
| Immigrants | Morocco | 85.2 /100 | #133 | Excellent 30.4% |
| Immigrants | South Eastern Asia | 85.2 /100 | #134 | Excellent 30.4% |
| Brazilians | 84.8 /100 | #135 | Excellent 30.4% |
| Immigrants | Scotland | 84.6 /100 | #136 | Excellent 30.4% |