Crow vs Immigrants from Serbia Currently Married

COMPARE

Crow
Race
Ancestry
AfghanAfricanAlaska NativeAlaskan AthabascanAlbanianAleutAlsatianAmericanApacheArabArapahoArgentineanArmenianAssyrian/Chaldean/SyriacAustralianAustrianBahamianBangladeshiBarbadianBasqueBelgianBelizeanBermudanBhutaneseBlackfeetBolivianBrazilianBritishBritish West IndianBulgarianBurmeseCajunCambodianCanadianCape VerdeanCarpatho RusynCelticCentral AmericanCentral American IndianCherokeeCheyenneChickasawChileanChineseChippewaChoctawColombianColvilleComancheCosta RicanCreeCreekCroatianCrowCubanCypriotCzechCzechoslovakianDanishDelawareDominicanDutchDutch West IndianEastern EuropeanEcuadorianEgyptianEnglishEstonianEthiopianEuropeanFijianFilipinoFinnishFrenchFrench American IndianFrench CanadianGermanGerman RussianGhanaianGreekGuamanian/ChamorroGuatemalanGuyaneseHaitianHmongHonduranHopiHoumaHungarianIcelanderIndian (Asian)IndonesianInupiatIranianIraqiIrishIroquoisIsraeliItalianJamaicanJapaneseJordanianKenyanKiowaKoreanLaotianLatvianLebaneseLiberianLithuanianLumbeeLuxembourgerMacedonianMalaysianMalteseMarshalleseMenomineeMexicanMexican American IndianMongolianMoroccanNative HawaiianNavajoNepaleseNew ZealanderNicaraguanNigerianNorthern EuropeanNorwegianOkinawanOsageOttawaPaiutePakistaniPalestinianPanamanianParaguayanPennsylvania GermanPeruvianPimaPolishPortuguesePotawatomiPuebloPuerto RicanPuget Sound SalishRomanianRussianSalvadoranSamoanScandinavianScotch-IrishScottishSeminoleSenegaleseSerbianShoshoneSierra LeoneanSiouxSlavicSlovakSloveneSomaliSouth AfricanSouth AmericanSouth American IndianSoviet UnionSpaniardSpanishSpanish AmericanSpanish American IndianSri LankanSubsaharan AfricanSudaneseSwedishSwissSyrianTaiwaneseThaiTlingit-HaidaTohono O'OdhamTonganTrinidadian and TobagonianTsimshianTurkishU.S. Virgin IslanderUgandanUkrainianUruguayanUteVenezuelanVietnameseWelshWest IndianYakamaYaquiYugoslavianYumanYup'ikZimbabwean
Immigration
NonimmigrantsImmigrantsAfghanistanAfricaAlbaniaArgentinaArmeniaAsiaAustraliaAustriaBahamasBangladeshBarbadosBelarusBelgiumBelizeBoliviaBosnia and HerzegovinaBrazilBulgariaBurma/MyanmarCabo VerdeCambodiaCameroonCanadaCaribbeanCentral AmericaChileChinaColombiaCongoCosta RicaCroatiaCubaCzechoslovakiaDenmarkDominicaDominican RepublicEastern AfricaEastern AsiaEastern EuropeEcuadorEgyptEl SalvadorEnglandEritreaEthiopiaEuropeFijiFranceGermanyGhanaGreeceGrenadaGuatemalaGuyanaHaitiHondurasHong KongHungaryIndiaIndonesiaIranIraqIrelandIsraelItalyJamaicaJapanJordanKazakhstanKenyaKoreaKuwaitLaosLatin AmericaLatviaLebanonLiberiaLithuaniaMalaysiaMexicoMicronesiaMiddle AfricaMoldovaMoroccoNepalNetherlandsNicaraguaNigeriaNorth AmericaNorth MacedoniaNorthern AfricaNorthern EuropeNorwayOceaniaPakistanPanamaPeruPhilippinesPolandPortugalRomaniaRussiaSaudi ArabiaScotlandSenegalSierra LeoneSingaporeSomaliaSouth AfricaSouth AmericaSouth Central AsiaSouth Eastern AsiaSouthern EuropeSpainSri LankaSt. Vincent and the GrenadinesSudanSwedenSwitzerlandSyriaTaiwanThailandTrinidad and TobagoTurkeyUgandaUkraineUruguayUzbekistanVenezuelaVietnamWest IndiesWestern AfricaWestern AsiaWestern EuropeYemenZaireZimbabweAzores
Immigrants from Serbia
Race
Ancestry
AfghanAfricanAlaska NativeAlaskan AthabascanAlbanianAleutAlsatianAmericanApacheArabArapahoArgentineanArmenianAssyrian/Chaldean/SyriacAustralianAustrianBahamianBangladeshiBarbadianBasqueBelgianBelizeanBermudanBhutaneseBlackfeetBolivianBrazilianBritishBritish West IndianBulgarianBurmeseCajunCambodianCanadianCape VerdeanCarpatho RusynCelticCentral AmericanCentral American IndianCherokeeCheyenneChickasawChileanChineseChippewaChoctawColombianColvilleComancheCosta RicanCreeCreekCroatianCubanCypriotCzechCzechoslovakianDanishDelawareDominicanDutchDutch West IndianEastern EuropeanEcuadorianEgyptianEnglishEstonianEthiopianEuropeanFijianFilipinoFinnishFrenchFrench American IndianFrench CanadianGermanGerman RussianGhanaianGreekGuamanian/ChamorroGuatemalanGuyaneseHaitianHmongHonduranHopiHoumaHungarianIcelanderIndian (Asian)IndonesianInupiatIranianIraqiIrishIroquoisIsraeliItalianJamaicanJapaneseJordanianKenyanKiowaKoreanLaotianLatvianLebaneseLiberianLithuanianLumbeeLuxembourgerMacedonianMalaysianMalteseMarshalleseMenomineeMexicanMexican American IndianMongolianMoroccanNative HawaiianNavajoNepaleseNew ZealanderNicaraguanNigerianNorthern EuropeanNorwegianOkinawanOsageOttawaPaiutePakistaniPalestinianPanamanianParaguayanPennsylvania GermanPeruvianPimaPolishPortuguesePotawatomiPuebloPuerto RicanPuget Sound SalishRomanianRussianSalvadoranSamoanScandinavianScotch-IrishScottishSeminoleSenegaleseSerbianShoshoneSierra LeoneanSiouxSlavicSlovakSloveneSomaliSouth AfricanSouth AmericanSouth American IndianSoviet UnionSpaniardSpanishSpanish AmericanSpanish American IndianSri LankanSubsaharan AfricanSudaneseSwedishSwissSyrianTaiwaneseThaiTlingit-HaidaTohono O'OdhamTonganTrinidadian and TobagonianTsimshianTurkishU.S. Virgin IslanderUgandanUkrainianUruguayanUteVenezuelanVietnameseWelshWest IndianYakamaYaquiYugoslavianYumanYup'ikZimbabwean
Immigration
NonimmigrantsImmigrantsAfghanistanAfricaAlbaniaArgentinaArmeniaAsiaAustraliaAustriaBahamasBangladeshBarbadosBelarusBelgiumBelizeBoliviaBosnia and HerzegovinaBrazilBulgariaBurma/MyanmarCabo VerdeCambodiaCameroonCanadaCaribbeanCentral AmericaChileChinaColombiaCongoCosta RicaCroatiaCubaCzechoslovakiaDenmarkDominicaDominican RepublicEastern AfricaEastern AsiaEastern EuropeEcuadorEgyptEl SalvadorEnglandEritreaEthiopiaEuropeFijiFranceGermanyGhanaGreeceGrenadaGuatemalaGuyanaHaitiHondurasHong KongHungaryIndiaIndonesiaIranIraqIrelandIsraelItalyJamaicaJapanJordanKazakhstanKenyaKoreaKuwaitLaosLatin AmericaLatviaLebanonLiberiaLithuaniaMalaysiaMexicoMicronesiaMiddle AfricaMoldovaMoroccoNepalNetherlandsNicaraguaNigeriaNorth AmericaNorth MacedoniaNorthern AfricaNorthern EuropeNorwayOceaniaPakistanPanamaPeruPhilippinesPolandPortugalRomaniaRussiaSaudi ArabiaScotlandSenegalSerbiaSierra LeoneSingaporeSomaliaSouth AfricaSouth AmericaSouth Central AsiaSouth Eastern AsiaSouthern EuropeSpainSri LankaSt. Vincent and the GrenadinesSudanSwedenSwitzerlandSyriaTaiwanThailandTrinidad and TobagoTurkeyUgandaUkraineUruguayUzbekistanVenezuelaVietnamWest IndiesWestern AfricaWestern AsiaWestern EuropeYemenZaireZimbabweAzores
Currently Married
Income
Poverty
Unemployment
Labor Participation
Family Structure
Vehicle Availability
Education Level
Disability

Currently Married Comparison

Crow

Immigrants from Serbia

Tragic
Good
40.4%
CURRENTLY MARRIED
0.0/ 100
METRIC RATING
329th/ 347
METRIC RANK
47.0%
CURRENTLY MARRIED
68.8/ 100
METRIC RATING
152nd/ 347
METRIC RANK

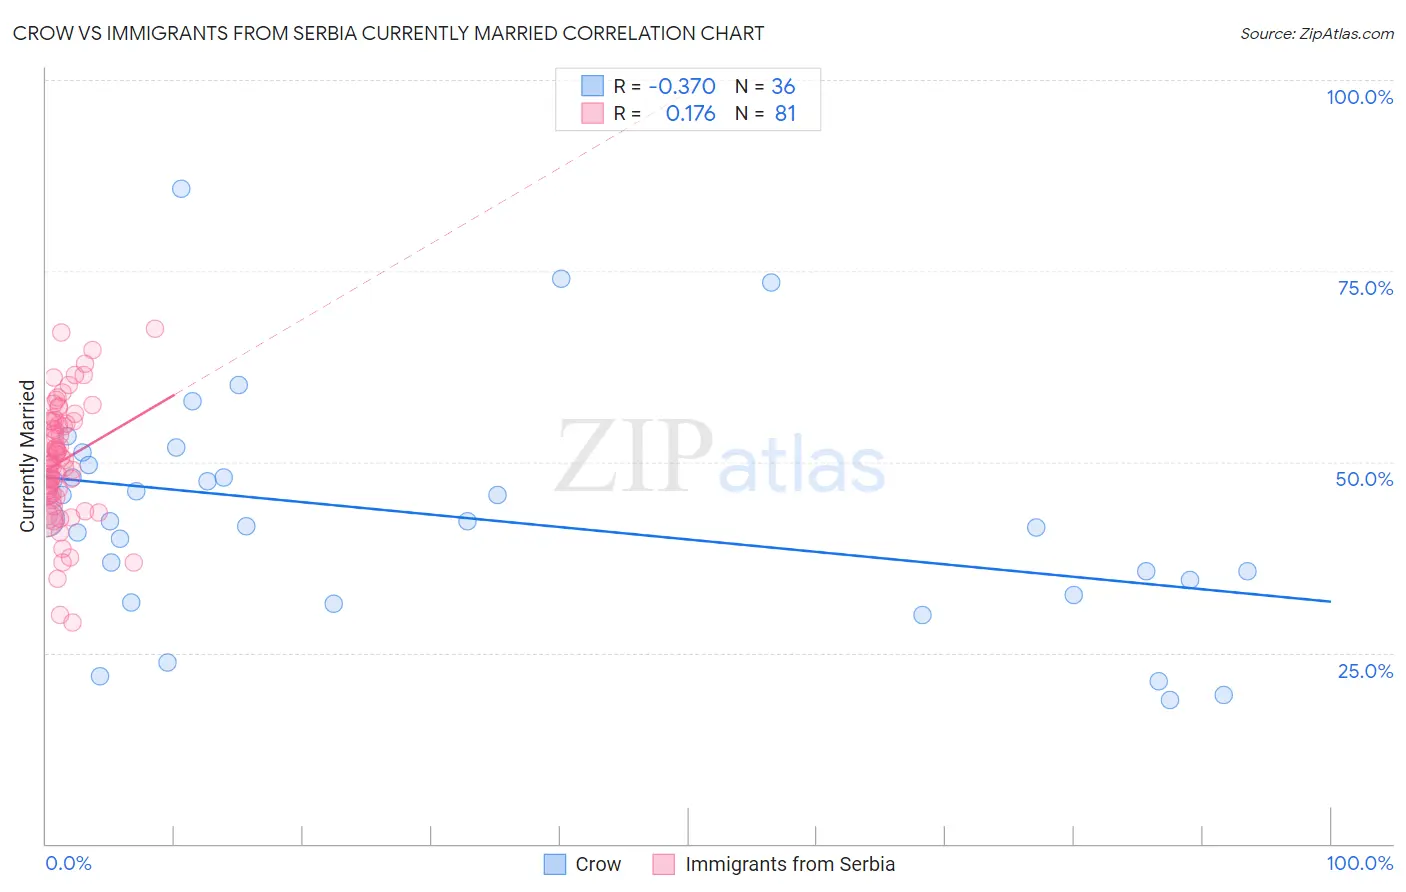
Crow vs Immigrants from Serbia Currently Married Correlation Chart

The statistical analysis conducted on geographies consisting of 59,208,662 people shows a mild negative correlation between the proportion of Crow and percentage of population currently married in the United States with a correlation coefficient (R) of -0.370 and weighted average of 40.4%. Similarly, the statistical analysis conducted on geographies consisting of 131,746,050 people shows a poor positive correlation between the proportion of Immigrants from Serbia and percentage of population currently married in the United States with a correlation coefficient (R) of 0.176 and weighted average of 47.0%, a difference of 16.3%.
Crow vs Immigrants from Serbia Currently Married

Currently Married Correlation Summary

MeasurementCrowImmigrants from Serbia
Minimum18.8%28.9%
Maximum85.8%67.4%
Range67.0%38.5%
Mean43.0%50.1%
Median42.2%50.1%
Interquartile 25% (IQ1)33.5%45.6%
Interquartile 75% (IQ3)48.8%55.3%
Interquartile Range (IQR)15.3%9.7%
Standard Deviation (Sample)15.0%7.6%
Standard Deviation (Population)14.8%7.6%

Similar Demographics by Currently Married

Demographics Similar to Crow by Currently Married

In terms of currently married, the demographic groups most similar to Crow are Immigrants from Dominica (40.3%, a difference of 0.090%), Immigrants from Barbados (40.3%, a difference of 0.10%), Arapaho (40.5%, a difference of 0.43%), Senegalese (40.6%, a difference of 0.47%), and Barbadian (40.6%, a difference of 0.65%).
DemographicsRating | RankCurrently Married
Immigrants | Haiti
0.0
/100
|
#322
Tragic
41.0%
Immigrants | West Indies
0.0
/100
|
#323
Tragic
40.7%
Immigrants | Senegal
0.0
/100
|
#324
Tragic
40.7%
U.S. Virgin Islanders
0.0
/100
|
#325
Tragic
40.7%
Barbadians
0.0
/100
|
#326
Tragic
40.6%
Senegalese
0.0
/100
|
#327
Tragic
40.6%
Arapaho
0.0
/100
|
#328
Tragic
40.5%
Crow
0.0
/100
|
#329
Tragic
40.4%
Immigrants | Dominica
0.0
/100
|
#330
Tragic
40.3%
Immigrants | Barbados
0.0
/100
|
#331
Tragic
40.3%
Immigrants | St. Vincent and the Grenadines
0.0
/100
|
#332
Tragic
40.1%
Yup'ik
0.0
/100
|
#333
Tragic
39.9%
Puerto Ricans
0.0
/100
|
#334
Tragic
39.9%
Lumbee
0.0
/100
|
#335
Tragic
39.8%
British West Indians
0.0
/100
|
#336
Tragic
39.8%

Demographics Similar to Immigrants from Serbia by Currently Married

In terms of currently married, the demographic groups most similar to Immigrants from Serbia are Immigrants from Venezuela (47.0%, a difference of 0.010%), Albanian (47.0%, a difference of 0.010%), Arab (47.0%, a difference of 0.010%), Spanish (47.0%, a difference of 0.030%), and Chilean (47.0%, a difference of 0.040%).
DemographicsRating | RankCurrently Married
Immigrants | South Eastern Asia
72.9
/100
|
#145
Good
47.1%
Carpatho Rusyns
72.6
/100
|
#146
Good
47.0%
Immigrants | Argentina
72.0
/100
|
#147
Good
47.0%
Cambodians
70.4
/100
|
#148
Good
47.0%
Zimbabweans
70.1
/100
|
#149
Good
47.0%
Immigrants | Turkey
70.0
/100
|
#150
Good
47.0%
Chileans
69.8
/100
|
#151
Good
47.0%
Immigrants | Serbia
68.8
/100
|
#152
Good
47.0%
Immigrants | Venezuela
68.6
/100
|
#153
Good
47.0%
Albanians
68.6
/100
|
#154
Good
47.0%
Arabs
68.6
/100
|
#155
Good
47.0%
Spanish
68.1
/100
|
#156
Good
47.0%
Immigrants | Switzerland
67.8
/100
|
#157
Good
46.9%
Cherokee
66.8
/100
|
#158
Good
46.9%
Iraqis
66.4
/100
|
#159
Good
46.9%