Crow vs Immigrants from Kenya Currently Married
COMPARE
Crow
Immigrants from Kenya
Currently Married
Currently Married Comparison
Crow
Immigrants from Kenya
40.4%
CURRENTLY MARRIED
0.0/ 100
METRIC RATING
329th/ 347
METRIC RANK
44.9%
CURRENTLY MARRIED
1.6/ 100
METRIC RATING
230th/ 347
METRIC RANK
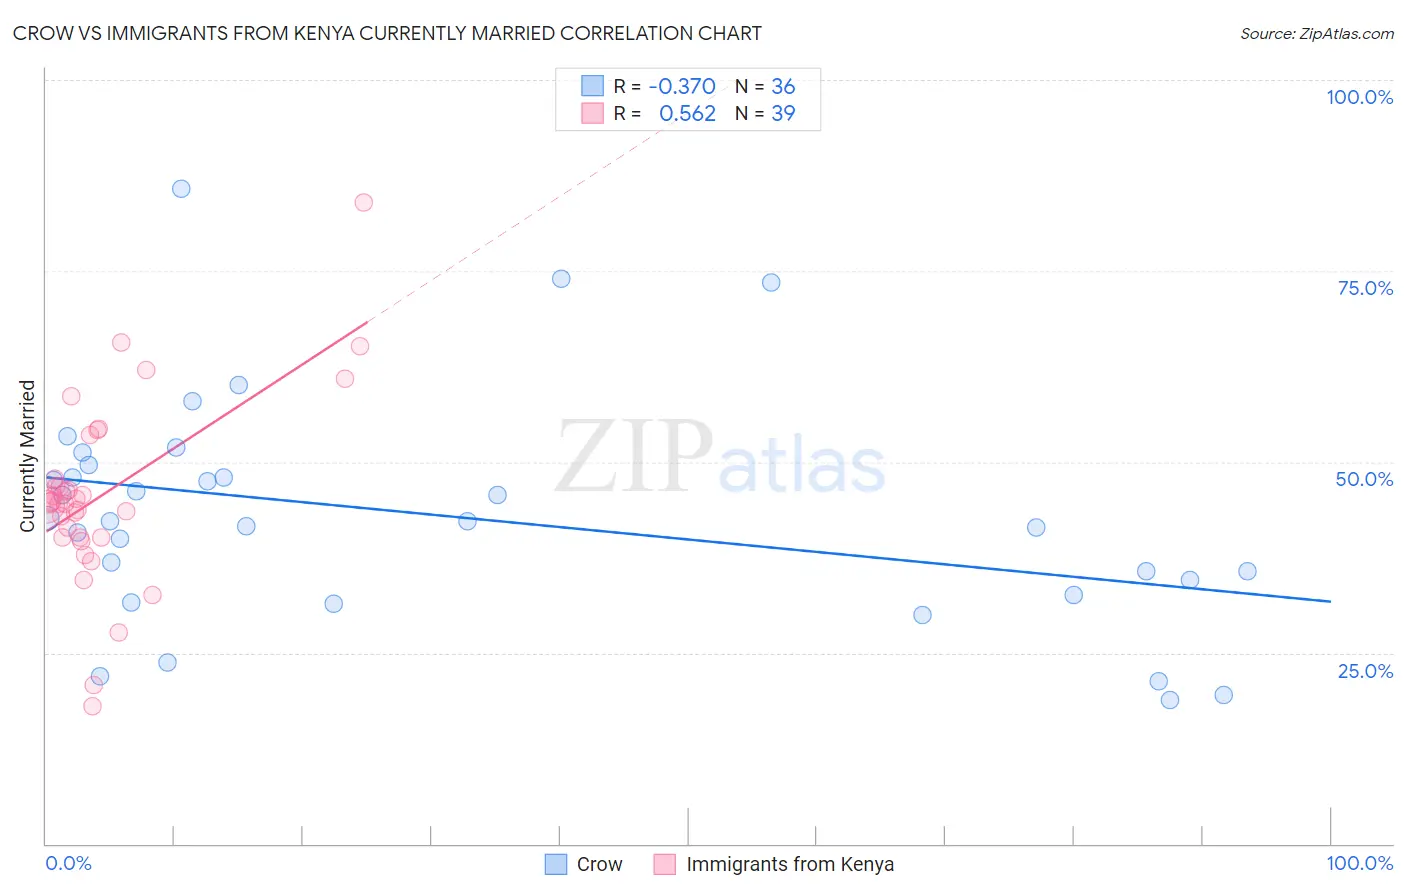
Crow vs Immigrants from Kenya Currently Married Correlation Chart
The statistical analysis conducted on geographies consisting of 59,208,662 people shows a mild negative correlation between the proportion of Crow and percentage of population currently married in the United States with a correlation coefficient (R) of -0.370 and weighted average of 40.4%. Similarly, the statistical analysis conducted on geographies consisting of 218,071,157 people shows a substantial positive correlation between the proportion of Immigrants from Kenya and percentage of population currently married in the United States with a correlation coefficient (R) of 0.562 and weighted average of 44.9%, a difference of 11.2%.
Currently Married Correlation Summary
| Measurement | Crow | Immigrants from Kenya |
| Minimum | 18.8% | 18.0% |
| Maximum | 85.8% | 83.9% |
| Range | 67.0% | 65.9% |
| Mean | 43.0% | 45.6% |
| Median | 42.2% | 44.8% |
| Interquartile 25% (IQ1) | 33.5% | 40.1% |
| Interquartile 75% (IQ3) | 48.8% | 47.8% |
| Interquartile Range (IQR) | 15.3% | 7.8% |
| Standard Deviation (Sample) | 15.0% | 12.0% |
| Standard Deviation (Population) | 14.8% | 11.8% |
Similar Demographics by Currently Married
Demographics Similar to Crow by Currently Married
In terms of currently married, the demographic groups most similar to Crow are Immigrants from Dominica (40.3%, a difference of 0.090%), Immigrants from Barbados (40.3%, a difference of 0.10%), Arapaho (40.5%, a difference of 0.43%), Senegalese (40.6%, a difference of 0.47%), and Barbadian (40.6%, a difference of 0.65%).
| Demographics | Rating | Rank | Currently Married |
| Immigrants | Haiti | 0.0 /100 | #322 | Tragic 41.0% |
| Immigrants | West Indies | 0.0 /100 | #323 | Tragic 40.7% |
| Immigrants | Senegal | 0.0 /100 | #324 | Tragic 40.7% |
| U.S. Virgin Islanders | 0.0 /100 | #325 | Tragic 40.7% |
| Barbadians | 0.0 /100 | #326 | Tragic 40.6% |
| Senegalese | 0.0 /100 | #327 | Tragic 40.6% |
| Arapaho | 0.0 /100 | #328 | Tragic 40.5% |
| Crow | 0.0 /100 | #329 | Tragic 40.4% |
| Immigrants | Dominica | 0.0 /100 | #330 | Tragic 40.3% |
| Immigrants | Barbados | 0.0 /100 | #331 | Tragic 40.3% |
| Immigrants | St. Vincent and the Grenadines | 0.0 /100 | #332 | Tragic 40.1% |
| Yup'ik | 0.0 /100 | #333 | Tragic 39.9% |
| Puerto Ricans | 0.0 /100 | #334 | Tragic 39.9% |
| Lumbee | 0.0 /100 | #335 | Tragic 39.8% |
| British West Indians | 0.0 /100 | #336 | Tragic 39.8% |
Demographics Similar to Immigrants from Kenya by Currently Married
In terms of currently married, the demographic groups most similar to Immigrants from Kenya are Cree (44.9%, a difference of 0.040%), Immigrants from Panama (44.9%, a difference of 0.040%), Immigrants from Uruguay (45.0%, a difference of 0.23%), Comanche (45.0%, a difference of 0.24%), and Spanish American (45.0%, a difference of 0.24%).
| Demographics | Rating | Rank | Currently Married |
| Immigrants | Laos | 2.3 /100 | #223 | Tragic 45.0% |
| Immigrants | Uganda | 2.2 /100 | #224 | Tragic 45.0% |
| French American Indians | 2.2 /100 | #225 | Tragic 45.0% |
| Comanche | 2.1 /100 | #226 | Tragic 45.0% |
| Spanish Americans | 2.1 /100 | #227 | Tragic 45.0% |
| Immigrants | Uruguay | 2.0 /100 | #228 | Tragic 45.0% |
| Cree | 1.7 /100 | #229 | Tragic 44.9% |
| Immigrants | Kenya | 1.6 /100 | #230 | Tragic 44.9% |
| Immigrants | Panama | 1.5 /100 | #231 | Tragic 44.9% |
| Nepalese | 1.2 /100 | #232 | Tragic 44.7% |
| Immigrants | Saudi Arabia | 1.1 /100 | #233 | Tragic 44.7% |
| Iroquois | 1.1 /100 | #234 | Tragic 44.7% |
| Alaskan Athabascans | 0.9 /100 | #235 | Tragic 44.6% |
| Cubans | 0.9 /100 | #236 | Tragic 44.6% |
| Seminole | 0.9 /100 | #237 | Tragic 44.6% |