Crow vs Immigrants from Eastern Asia Currently Married
COMPARE
Crow
Immigrants from Eastern Asia
Currently Married
Currently Married Comparison
Crow
Immigrants from Eastern Asia
40.4%
CURRENTLY MARRIED
0.0/ 100
METRIC RATING
329th/ 347
METRIC RANK
48.2%
CURRENTLY MARRIED
97.5/ 100
METRIC RATING
73rd/ 347
METRIC RANK
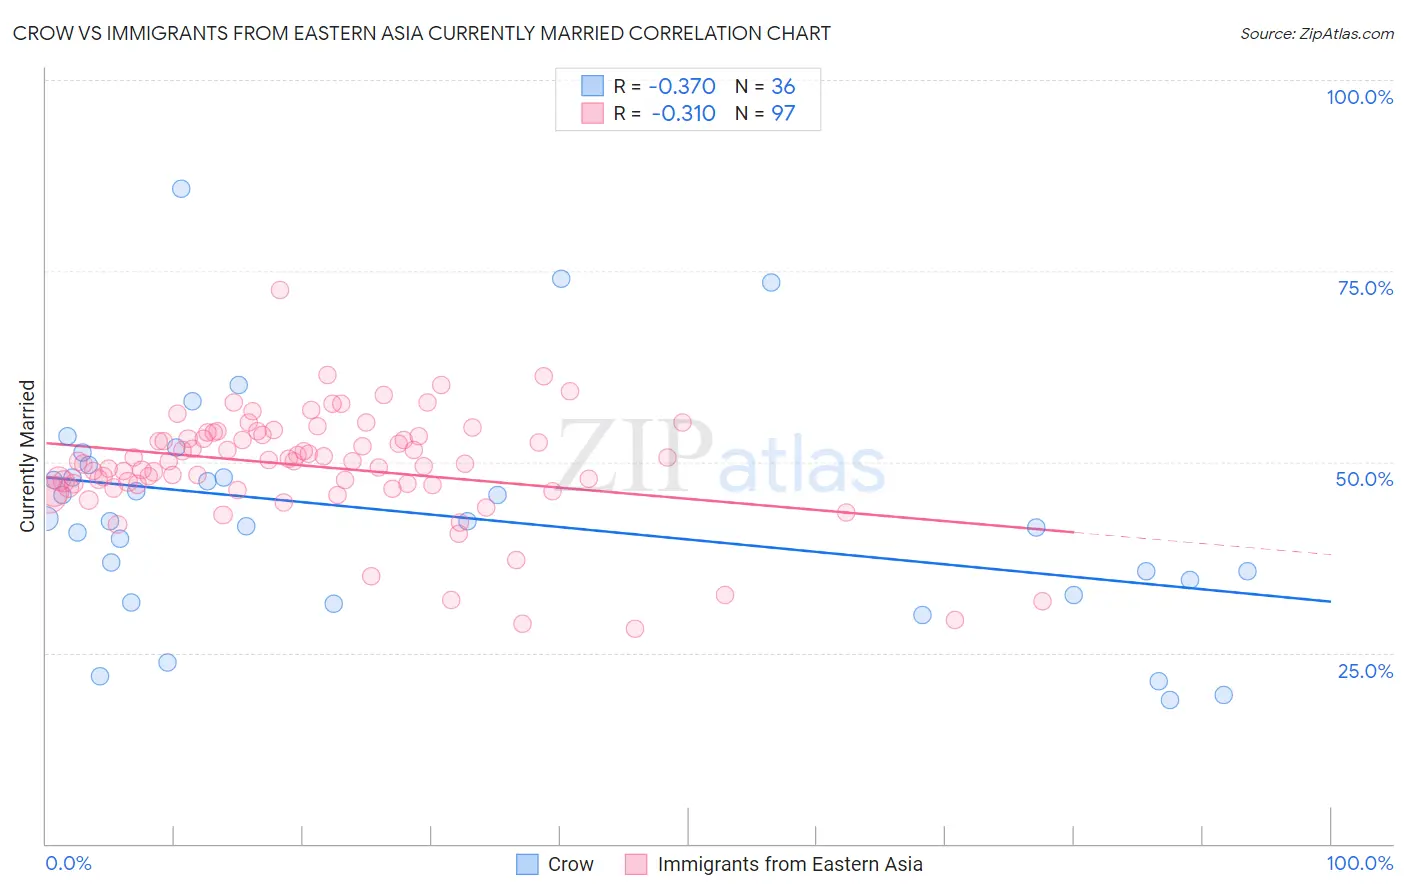
Crow vs Immigrants from Eastern Asia Currently Married Correlation Chart
The statistical analysis conducted on geographies consisting of 59,208,662 people shows a mild negative correlation between the proportion of Crow and percentage of population currently married in the United States with a correlation coefficient (R) of -0.370 and weighted average of 40.4%. Similarly, the statistical analysis conducted on geographies consisting of 499,820,876 people shows a mild negative correlation between the proportion of Immigrants from Eastern Asia and percentage of population currently married in the United States with a correlation coefficient (R) of -0.310 and weighted average of 48.2%, a difference of 19.4%.
Currently Married Correlation Summary
| Measurement | Crow | Immigrants from Eastern Asia |
| Minimum | 18.8% | 28.1% |
| Maximum | 85.8% | 72.5% |
| Range | 67.0% | 44.4% |
| Mean | 43.0% | 49.4% |
| Median | 42.2% | 50.0% |
| Interquartile 25% (IQ1) | 33.5% | 46.8% |
| Interquartile 75% (IQ3) | 48.8% | 53.5% |
| Interquartile Range (IQR) | 15.3% | 6.7% |
| Standard Deviation (Sample) | 15.0% | 7.2% |
| Standard Deviation (Population) | 14.8% | 7.2% |
Similar Demographics by Currently Married
Demographics Similar to Crow by Currently Married
In terms of currently married, the demographic groups most similar to Crow are Immigrants from Dominica (40.3%, a difference of 0.090%), Immigrants from Barbados (40.3%, a difference of 0.10%), Arapaho (40.5%, a difference of 0.43%), Senegalese (40.6%, a difference of 0.47%), and Barbadian (40.6%, a difference of 0.65%).
| Demographics | Rating | Rank | Currently Married |
| Immigrants | Haiti | 0.0 /100 | #322 | Tragic 41.0% |
| Immigrants | West Indies | 0.0 /100 | #323 | Tragic 40.7% |
| Immigrants | Senegal | 0.0 /100 | #324 | Tragic 40.7% |
| U.S. Virgin Islanders | 0.0 /100 | #325 | Tragic 40.7% |
| Barbadians | 0.0 /100 | #326 | Tragic 40.6% |
| Senegalese | 0.0 /100 | #327 | Tragic 40.6% |
| Arapaho | 0.0 /100 | #328 | Tragic 40.5% |
| Crow | 0.0 /100 | #329 | Tragic 40.4% |
| Immigrants | Dominica | 0.0 /100 | #330 | Tragic 40.3% |
| Immigrants | Barbados | 0.0 /100 | #331 | Tragic 40.3% |
| Immigrants | St. Vincent and the Grenadines | 0.0 /100 | #332 | Tragic 40.1% |
| Yup'ik | 0.0 /100 | #333 | Tragic 39.9% |
| Puerto Ricans | 0.0 /100 | #334 | Tragic 39.9% |
| Lumbee | 0.0 /100 | #335 | Tragic 39.8% |
| British West Indians | 0.0 /100 | #336 | Tragic 39.8% |
Demographics Similar to Immigrants from Eastern Asia by Currently Married
In terms of currently married, the demographic groups most similar to Immigrants from Eastern Asia are Immigrants from Lebanon (48.2%, a difference of 0.020%), Estonian (48.2%, a difference of 0.030%), Immigrants from Belarus (48.1%, a difference of 0.10%), Basque (48.1%, a difference of 0.12%), and Slovene (48.1%, a difference of 0.14%).
| Demographics | Rating | Rank | Currently Married |
| Tongans | 98.2 /100 | #66 | Exceptional 48.3% |
| Slovaks | 98.2 /100 | #67 | Exceptional 48.3% |
| Immigrants | England | 98.2 /100 | #68 | Exceptional 48.3% |
| Canadians | 98.1 /100 | #69 | Exceptional 48.3% |
| Immigrants | Asia | 97.9 /100 | #70 | Exceptional 48.3% |
| Macedonians | 97.9 /100 | #71 | Exceptional 48.3% |
| Immigrants | Lebanon | 97.6 /100 | #72 | Exceptional 48.2% |
| Immigrants | Eastern Asia | 97.5 /100 | #73 | Exceptional 48.2% |
| Estonians | 97.4 /100 | #74 | Exceptional 48.2% |
| Immigrants | Belarus | 97.2 /100 | #75 | Exceptional 48.1% |
| Basques | 97.2 /100 | #76 | Exceptional 48.1% |
| Slovenes | 97.1 /100 | #77 | Exceptional 48.1% |
| Immigrants | Belgium | 97.1 /100 | #78 | Exceptional 48.1% |
| Immigrants | South Africa | 97.0 /100 | #79 | Exceptional 48.1% |
| Immigrants | Poland | 96.9 /100 | #80 | Exceptional 48.1% |