Romanian vs Immigrants from Serbia Currently Married
COMPARE
Romanian
Immigrants from Serbia
Currently Married
Currently Married Comparison
Romanians
Immigrants from Serbia
48.4%
CURRENTLY MARRIED
98.5/ 100
METRIC RATING
61st/ 347
METRIC RANK
47.0%
CURRENTLY MARRIED
68.8/ 100
METRIC RATING
152nd/ 347
METRIC RANK
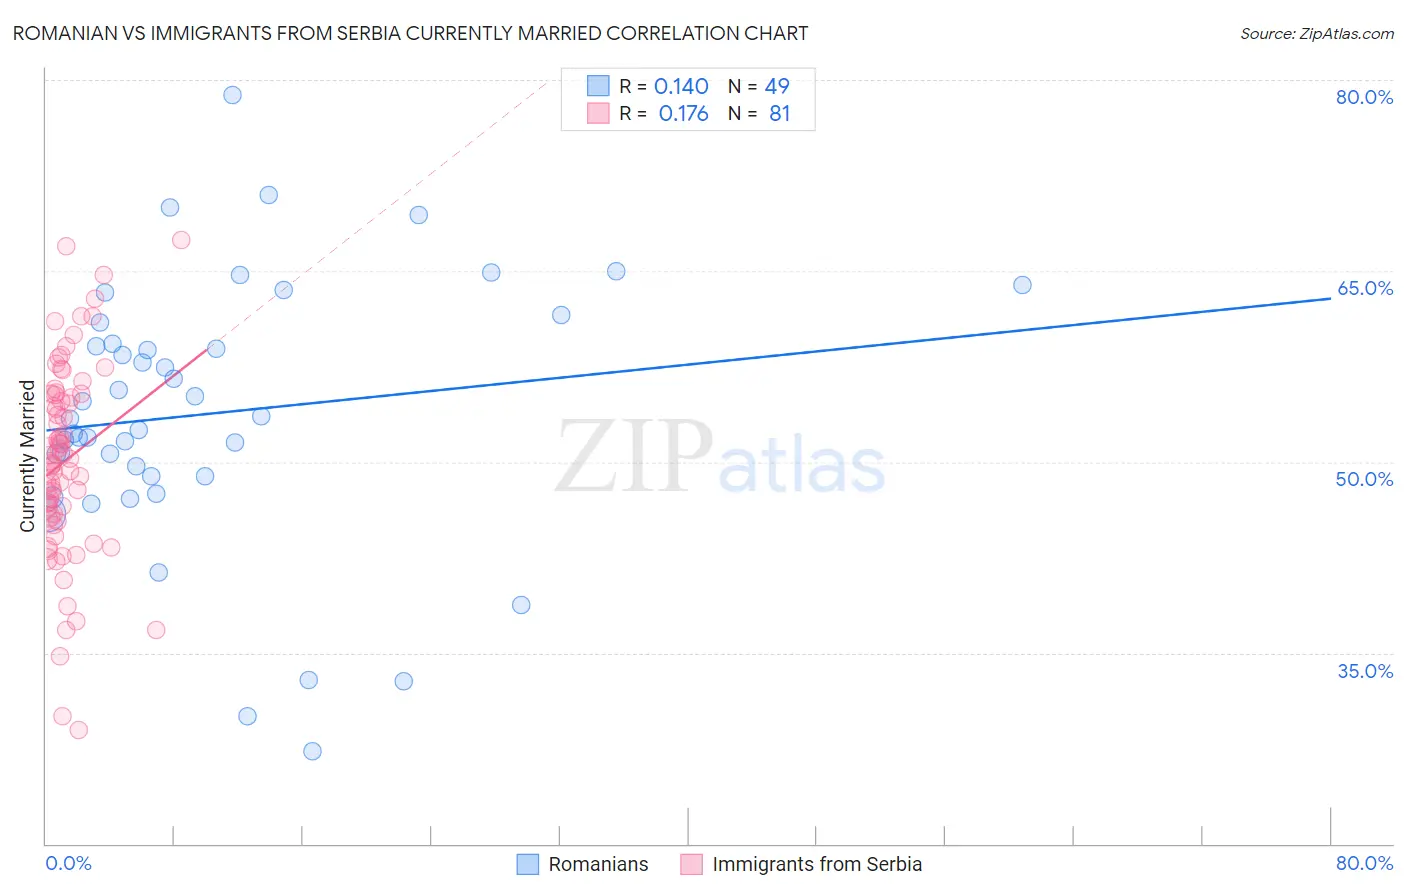
Romanian vs Immigrants from Serbia Currently Married Correlation Chart
The statistical analysis conducted on geographies consisting of 377,883,259 people shows a poor positive correlation between the proportion of Romanians and percentage of population currently married in the United States with a correlation coefficient (R) of 0.140 and weighted average of 48.4%. Similarly, the statistical analysis conducted on geographies consisting of 131,746,050 people shows a poor positive correlation between the proportion of Immigrants from Serbia and percentage of population currently married in the United States with a correlation coefficient (R) of 0.176 and weighted average of 47.0%, a difference of 3.1%.
Currently Married Correlation Summary
| Measurement | Romanian | Immigrants from Serbia |
| Minimum | 27.3% | 28.9% |
| Maximum | 78.8% | 67.4% |
| Range | 51.5% | 38.5% |
| Mean | 53.8% | 50.1% |
| Median | 53.4% | 50.1% |
| Interquartile 25% (IQ1) | 48.9% | 45.6% |
| Interquartile 75% (IQ3) | 60.1% | 55.3% |
| Interquartile Range (IQR) | 11.2% | 9.7% |
| Standard Deviation (Sample) | 10.5% | 7.6% |
| Standard Deviation (Population) | 10.4% | 7.6% |
Similar Demographics by Currently Married
Demographics Similar to Romanians by Currently Married
In terms of currently married, the demographic groups most similar to Romanians are Asian (48.4%, a difference of 0.0%), Immigrants from Romania (48.4%, a difference of 0.010%), Immigrants from Ireland (48.4%, a difference of 0.030%), French (48.4%, a difference of 0.050%), and Immigrants from Netherlands (48.5%, a difference of 0.10%).
| Demographics | Rating | Rank | Currently Married |
| Immigrants | Moldova | 98.7 /100 | #54 | Exceptional 48.5% |
| Immigrants | North Macedonia | 98.7 /100 | #55 | Exceptional 48.5% |
| Latvians | 98.7 /100 | #56 | Exceptional 48.5% |
| Immigrants | Netherlands | 98.6 /100 | #57 | Exceptional 48.5% |
| French | 98.6 /100 | #58 | Exceptional 48.4% |
| Immigrants | Ireland | 98.5 /100 | #59 | Exceptional 48.4% |
| Immigrants | Romania | 98.5 /100 | #60 | Exceptional 48.4% |
| Romanians | 98.5 /100 | #61 | Exceptional 48.4% |
| Asians | 98.5 /100 | #62 | Exceptional 48.4% |
| Slavs | 98.3 /100 | #63 | Exceptional 48.4% |
| Immigrants | Czechoslovakia | 98.3 /100 | #64 | Exceptional 48.4% |
| Ukrainians | 98.3 /100 | #65 | Exceptional 48.4% |
| Tongans | 98.2 /100 | #66 | Exceptional 48.3% |
| Slovaks | 98.2 /100 | #67 | Exceptional 48.3% |
| Immigrants | England | 98.2 /100 | #68 | Exceptional 48.3% |
Demographics Similar to Immigrants from Serbia by Currently Married
In terms of currently married, the demographic groups most similar to Immigrants from Serbia are Immigrants from Venezuela (47.0%, a difference of 0.010%), Albanian (47.0%, a difference of 0.010%), Arab (47.0%, a difference of 0.010%), Spanish (47.0%, a difference of 0.030%), and Chilean (47.0%, a difference of 0.040%).
| Demographics | Rating | Rank | Currently Married |
| Immigrants | South Eastern Asia | 72.9 /100 | #145 | Good 47.1% |
| Carpatho Rusyns | 72.6 /100 | #146 | Good 47.0% |
| Immigrants | Argentina | 72.0 /100 | #147 | Good 47.0% |
| Cambodians | 70.4 /100 | #148 | Good 47.0% |
| Zimbabweans | 70.1 /100 | #149 | Good 47.0% |
| Immigrants | Turkey | 70.0 /100 | #150 | Good 47.0% |
| Chileans | 69.8 /100 | #151 | Good 47.0% |
| Immigrants | Serbia | 68.8 /100 | #152 | Good 47.0% |
| Immigrants | Venezuela | 68.6 /100 | #153 | Good 47.0% |
| Albanians | 68.6 /100 | #154 | Good 47.0% |
| Arabs | 68.6 /100 | #155 | Good 47.0% |
| Spanish | 68.1 /100 | #156 | Good 47.0% |
| Immigrants | Switzerland | 67.8 /100 | #157 | Good 46.9% |
| Cherokee | 66.8 /100 | #158 | Good 46.9% |
| Iraqis | 66.4 /100 | #159 | Good 46.9% |