Croatian vs Immigrants from Serbia Currently Married
COMPARE
Croatian
Immigrants from Serbia
Currently Married
Currently Married Comparison
Croatians
Immigrants from Serbia
48.9%
CURRENTLY MARRIED
99.5/ 100
METRIC RATING
29th/ 347
METRIC RANK
47.0%
CURRENTLY MARRIED
68.8/ 100
METRIC RATING
152nd/ 347
METRIC RANK
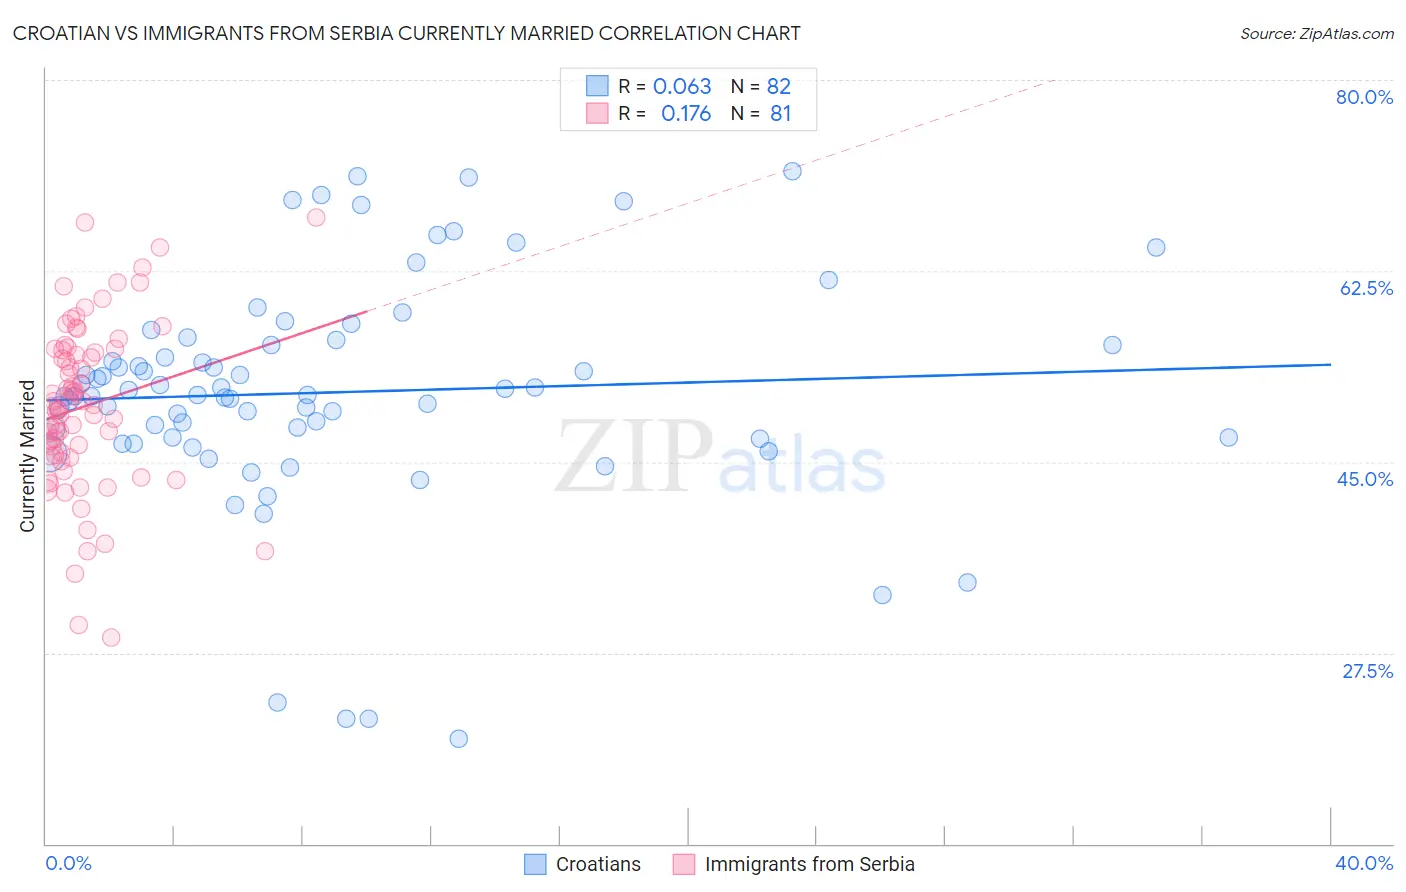
Croatian vs Immigrants from Serbia Currently Married Correlation Chart
The statistical analysis conducted on geographies consisting of 375,687,747 people shows a slight positive correlation between the proportion of Croatians and percentage of population currently married in the United States with a correlation coefficient (R) of 0.063 and weighted average of 48.9%. Similarly, the statistical analysis conducted on geographies consisting of 131,746,050 people shows a poor positive correlation between the proportion of Immigrants from Serbia and percentage of population currently married in the United States with a correlation coefficient (R) of 0.176 and weighted average of 47.0%, a difference of 4.1%.
Currently Married Correlation Summary
| Measurement | Croatian | Immigrants from Serbia |
| Minimum | 19.6% | 28.9% |
| Maximum | 71.7% | 67.4% |
| Range | 52.1% | 38.5% |
| Mean | 51.4% | 50.1% |
| Median | 51.1% | 50.1% |
| Interquartile 25% (IQ1) | 47.2% | 45.6% |
| Interquartile 75% (IQ3) | 55.7% | 55.3% |
| Interquartile Range (IQR) | 8.5% | 9.7% |
| Standard Deviation (Sample) | 10.5% | 7.6% |
| Standard Deviation (Population) | 10.4% | 7.6% |
Similar Demographics by Currently Married
Demographics Similar to Croatians by Currently Married
In terms of currently married, the demographic groups most similar to Croatians are Eastern European (48.9%, a difference of 0.010%), Polish (48.9%, a difference of 0.010%), Immigrants from Hong Kong (48.9%, a difference of 0.020%), Welsh (48.9%, a difference of 0.050%), and Irish (48.9%, a difference of 0.060%).
| Demographics | Rating | Rank | Currently Married |
| Bulgarians | 99.7 /100 | #22 | Exceptional 49.1% |
| Immigrants | Pakistan | 99.7 /100 | #23 | Exceptional 49.1% |
| Lithuanians | 99.6 /100 | #24 | Exceptional 49.0% |
| Maltese | 99.6 /100 | #25 | Exceptional 49.0% |
| Immigrants | Korea | 99.6 /100 | #26 | Exceptional 49.0% |
| Burmese | 99.6 /100 | #27 | Exceptional 48.9% |
| Welsh | 99.5 /100 | #28 | Exceptional 48.9% |
| Croatians | 99.5 /100 | #29 | Exceptional 48.9% |
| Eastern Europeans | 99.5 /100 | #30 | Exceptional 48.9% |
| Poles | 99.5 /100 | #31 | Exceptional 48.9% |
| Immigrants | Hong Kong | 99.5 /100 | #32 | Exceptional 48.9% |
| Irish | 99.5 /100 | #33 | Exceptional 48.9% |
| Immigrants | Lithuania | 99.4 /100 | #34 | Exceptional 48.8% |
| Immigrants | Northern Europe | 99.4 /100 | #35 | Exceptional 48.8% |
| Italians | 99.4 /100 | #36 | Exceptional 48.8% |
Demographics Similar to Immigrants from Serbia by Currently Married
In terms of currently married, the demographic groups most similar to Immigrants from Serbia are Immigrants from Venezuela (47.0%, a difference of 0.010%), Albanian (47.0%, a difference of 0.010%), Arab (47.0%, a difference of 0.010%), Spanish (47.0%, a difference of 0.030%), and Chilean (47.0%, a difference of 0.040%).
| Demographics | Rating | Rank | Currently Married |
| Immigrants | South Eastern Asia | 72.9 /100 | #145 | Good 47.1% |
| Carpatho Rusyns | 72.6 /100 | #146 | Good 47.0% |
| Immigrants | Argentina | 72.0 /100 | #147 | Good 47.0% |
| Cambodians | 70.4 /100 | #148 | Good 47.0% |
| Zimbabweans | 70.1 /100 | #149 | Good 47.0% |
| Immigrants | Turkey | 70.0 /100 | #150 | Good 47.0% |
| Chileans | 69.8 /100 | #151 | Good 47.0% |
| Immigrants | Serbia | 68.8 /100 | #152 | Good 47.0% |
| Immigrants | Venezuela | 68.6 /100 | #153 | Good 47.0% |
| Albanians | 68.6 /100 | #154 | Good 47.0% |
| Arabs | 68.6 /100 | #155 | Good 47.0% |
| Spanish | 68.1 /100 | #156 | Good 47.0% |
| Immigrants | Switzerland | 67.8 /100 | #157 | Good 46.9% |
| Cherokee | 66.8 /100 | #158 | Good 46.9% |
| Iraqis | 66.4 /100 | #159 | Good 46.9% |