Crow vs Immigrants from Ghana Currently Married
COMPARE
Crow
Immigrants from Ghana
Currently Married
Currently Married Comparison
Crow
Immigrants from Ghana
40.4%
CURRENTLY MARRIED
0.0/ 100
METRIC RATING
329th/ 347
METRIC RANK
42.7%
CURRENTLY MARRIED
0.0/ 100
METRIC RATING
290th/ 347
METRIC RANK
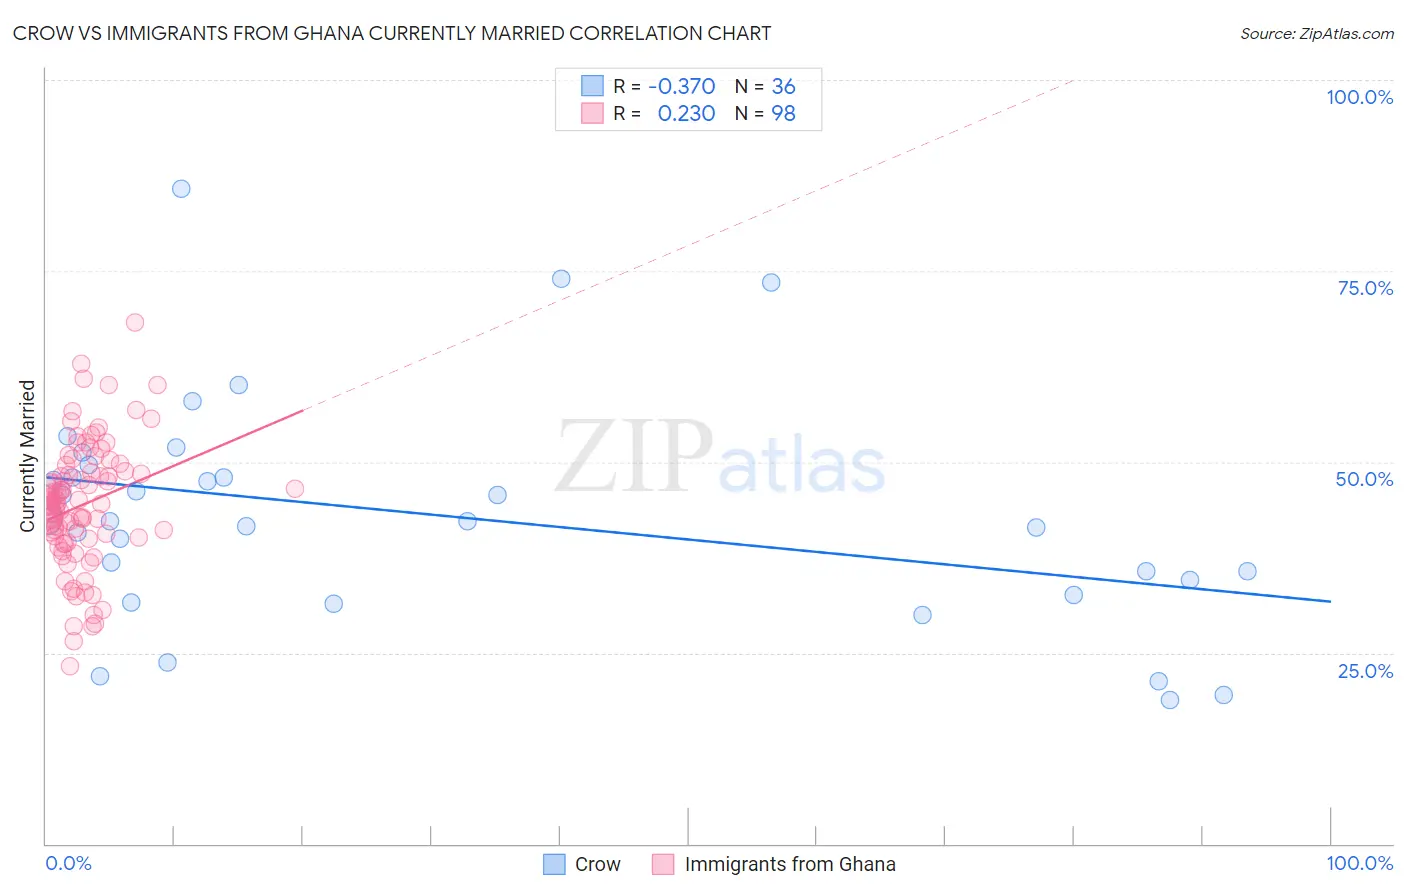
Crow vs Immigrants from Ghana Currently Married Correlation Chart
The statistical analysis conducted on geographies consisting of 59,208,662 people shows a mild negative correlation between the proportion of Crow and percentage of population currently married in the United States with a correlation coefficient (R) of -0.370 and weighted average of 40.4%. Similarly, the statistical analysis conducted on geographies consisting of 199,931,543 people shows a weak positive correlation between the proportion of Immigrants from Ghana and percentage of population currently married in the United States with a correlation coefficient (R) of 0.230 and weighted average of 42.7%, a difference of 5.8%.
Currently Married Correlation Summary
| Measurement | Crow | Immigrants from Ghana |
| Minimum | 18.8% | 23.3% |
| Maximum | 85.8% | 68.3% |
| Range | 67.0% | 45.0% |
| Mean | 43.0% | 44.4% |
| Median | 42.2% | 44.5% |
| Interquartile 25% (IQ1) | 33.5% | 39.9% |
| Interquartile 75% (IQ3) | 48.8% | 48.7% |
| Interquartile Range (IQR) | 15.3% | 8.8% |
| Standard Deviation (Sample) | 15.0% | 8.3% |
| Standard Deviation (Population) | 14.8% | 8.2% |
Similar Demographics by Currently Married
Demographics Similar to Crow by Currently Married
In terms of currently married, the demographic groups most similar to Crow are Immigrants from Dominica (40.3%, a difference of 0.090%), Immigrants from Barbados (40.3%, a difference of 0.10%), Arapaho (40.5%, a difference of 0.43%), Senegalese (40.6%, a difference of 0.47%), and Barbadian (40.6%, a difference of 0.65%).
| Demographics | Rating | Rank | Currently Married |
| Immigrants | Haiti | 0.0 /100 | #322 | Tragic 41.0% |
| Immigrants | West Indies | 0.0 /100 | #323 | Tragic 40.7% |
| Immigrants | Senegal | 0.0 /100 | #324 | Tragic 40.7% |
| U.S. Virgin Islanders | 0.0 /100 | #325 | Tragic 40.7% |
| Barbadians | 0.0 /100 | #326 | Tragic 40.6% |
| Senegalese | 0.0 /100 | #327 | Tragic 40.6% |
| Arapaho | 0.0 /100 | #328 | Tragic 40.5% |
| Crow | 0.0 /100 | #329 | Tragic 40.4% |
| Immigrants | Dominica | 0.0 /100 | #330 | Tragic 40.3% |
| Immigrants | Barbados | 0.0 /100 | #331 | Tragic 40.3% |
| Immigrants | St. Vincent and the Grenadines | 0.0 /100 | #332 | Tragic 40.1% |
| Yup'ik | 0.0 /100 | #333 | Tragic 39.9% |
| Puerto Ricans | 0.0 /100 | #334 | Tragic 39.9% |
| Lumbee | 0.0 /100 | #335 | Tragic 39.8% |
| British West Indians | 0.0 /100 | #336 | Tragic 39.8% |
Demographics Similar to Immigrants from Ghana by Currently Married
In terms of currently married, the demographic groups most similar to Immigrants from Ghana are Paiute (42.7%, a difference of 0.010%), Immigrants from Guatemala (42.6%, a difference of 0.12%), Native/Alaskan (42.8%, a difference of 0.24%), Subsaharan African (42.6%, a difference of 0.27%), and Yuman (42.6%, a difference of 0.29%).
| Demographics | Rating | Rank | Currently Married |
| Kiowa | 0.0 /100 | #283 | Tragic 43.2% |
| Immigrants | El Salvador | 0.0 /100 | #284 | Tragic 43.1% |
| Immigrants | Middle Africa | 0.0 /100 | #285 | Tragic 43.0% |
| Ghanaians | 0.0 /100 | #286 | Tragic 42.9% |
| Guatemalans | 0.0 /100 | #287 | Tragic 42.9% |
| Natives/Alaskans | 0.0 /100 | #288 | Tragic 42.8% |
| Paiute | 0.0 /100 | #289 | Tragic 42.7% |
| Immigrants | Ghana | 0.0 /100 | #290 | Tragic 42.7% |
| Immigrants | Guatemala | 0.0 /100 | #291 | Tragic 42.6% |
| Sub-Saharan Africans | 0.0 /100 | #292 | Tragic 42.6% |
| Yuman | 0.0 /100 | #293 | Tragic 42.6% |
| Hondurans | 0.0 /100 | #294 | Tragic 42.5% |
| Immigrants | Western Africa | 0.0 /100 | #295 | Tragic 42.4% |
| Menominee | 0.0 /100 | #296 | Tragic 42.3% |
| Cheyenne | 0.0 /100 | #297 | Tragic 42.2% |