Crow vs Immigrants from Serbia Female Poverty Among 18-24 Year Olds
COMPARE
Crow
Immigrants from Serbia
Female Poverty Among 18-24 Year Olds
Female Poverty Among 18-24 Year Olds Comparison
Crow
Immigrants from Serbia
33.2%
FEMALE POVERTY AMONG 18-24 YEAR OLDS
0.0/ 100
METRIC RATING
347th/ 347
METRIC RANK
19.2%
FEMALE POVERTY AMONG 18-24 YEAR OLDS
97.1/ 100
METRIC RATING
111th/ 347
METRIC RANK
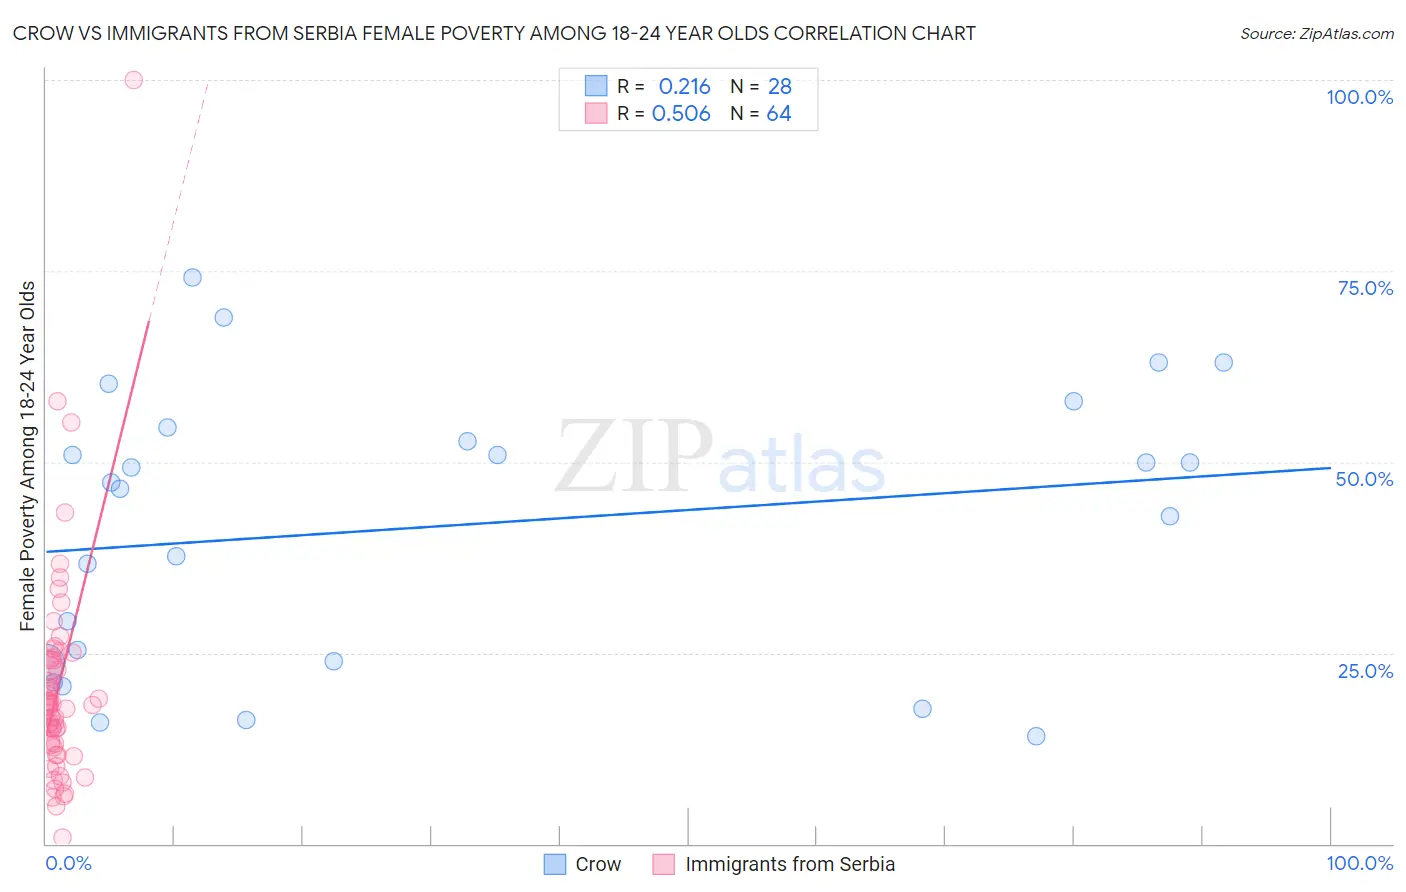
Crow vs Immigrants from Serbia Female Poverty Among 18-24 Year Olds Correlation Chart
The statistical analysis conducted on geographies consisting of 58,788,428 people shows a weak positive correlation between the proportion of Crow and poverty level among females between the ages 18 and 24 in the United States with a correlation coefficient (R) of 0.216 and weighted average of 33.2%. Similarly, the statistical analysis conducted on geographies consisting of 130,475,309 people shows a substantial positive correlation between the proportion of Immigrants from Serbia and poverty level among females between the ages 18 and 24 in the United States with a correlation coefficient (R) of 0.506 and weighted average of 19.2%, a difference of 72.6%.
Female Poverty Among 18-24 Year Olds Correlation Summary
| Measurement | Crow | Immigrants from Serbia |
| Minimum | 14.1% | 0.90% |
| Maximum | 74.1% | 100.0% |
| Range | 60.0% | 99.1% |
| Mean | 41.6% | 20.4% |
| Median | 46.8% | 18.2% |
| Interquartile 25% (IQ1) | 23.8% | 12.8% |
| Interquartile 75% (IQ3) | 53.6% | 24.0% |
| Interquartile Range (IQR) | 29.8% | 11.2% |
| Standard Deviation (Sample) | 17.9% | 14.6% |
| Standard Deviation (Population) | 17.6% | 14.5% |
Similar Demographics by Female Poverty Among 18-24 Year Olds
Demographics Similar to Crow by Female Poverty Among 18-24 Year Olds
In terms of female poverty among 18-24 year olds, the demographic groups most similar to Crow are Lumbee (31.1%, a difference of 7.0%), Tohono O'odham (31.0%, a difference of 7.1%), Navajo (30.3%, a difference of 9.6%), Puerto Rican (29.8%, a difference of 11.3%), and Kiowa (29.2%, a difference of 13.6%).
| Demographics | Rating | Rank | Female Poverty Among 18-24 Year Olds |
| Apache | 0.0 /100 | #333 | Tragic 26.3% |
| Pueblo | 0.0 /100 | #334 | Tragic 26.9% |
| Yup'ik | 0.0 /100 | #335 | Tragic 27.0% |
| Immigrants | Yemen | 0.0 /100 | #336 | Tragic 27.5% |
| Cheyenne | 0.0 /100 | #337 | Tragic 28.1% |
| Hopi | 0.0 /100 | #338 | Tragic 28.2% |
| Pima | 0.0 /100 | #339 | Tragic 28.4% |
| Sioux | 0.0 /100 | #340 | Tragic 28.6% |
| Colville | 0.0 /100 | #341 | Tragic 29.0% |
| Kiowa | 0.0 /100 | #342 | Tragic 29.2% |
| Puerto Ricans | 0.0 /100 | #343 | Tragic 29.8% |
| Navajo | 0.0 /100 | #344 | Tragic 30.3% |
| Tohono O'odham | 0.0 /100 | #345 | Tragic 31.0% |
| Lumbee | 0.0 /100 | #346 | Tragic 31.1% |
| Crow | 0.0 /100 | #347 | Tragic 33.2% |
Demographics Similar to Immigrants from Serbia by Female Poverty Among 18-24 Year Olds
In terms of female poverty among 18-24 year olds, the demographic groups most similar to Immigrants from Serbia are Laotian (19.2%, a difference of 0.020%), Immigrants from Syria (19.2%, a difference of 0.040%), Immigrants from Uzbekistan (19.2%, a difference of 0.12%), Immigrants from Sri Lanka (19.2%, a difference of 0.22%), and Immigrants from El Salvador (19.3%, a difference of 0.23%).
| Demographics | Rating | Rank | Female Poverty Among 18-24 Year Olds |
| Immigrants | Afghanistan | 98.0 /100 | #104 | Exceptional 19.1% |
| Immigrants | Ecuador | 97.8 /100 | #105 | Exceptional 19.2% |
| Immigrants | Sierra Leone | 97.8 /100 | #106 | Exceptional 19.2% |
| Immigrants | Sri Lanka | 97.5 /100 | #107 | Exceptional 19.2% |
| Immigrants | Uzbekistan | 97.3 /100 | #108 | Exceptional 19.2% |
| Immigrants | Syria | 97.2 /100 | #109 | Exceptional 19.2% |
| Laotians | 97.1 /100 | #110 | Exceptional 19.2% |
| Immigrants | Serbia | 97.1 /100 | #111 | Exceptional 19.2% |
| Immigrants | El Salvador | 96.5 /100 | #112 | Exceptional 19.3% |
| Immigrants | Cameroon | 96.3 /100 | #113 | Exceptional 19.3% |
| Slovenes | 96.2 /100 | #114 | Exceptional 19.3% |
| Immigrants | Hungary | 96.2 /100 | #115 | Exceptional 19.3% |
| Immigrants | Immigrants | 95.9 /100 | #116 | Exceptional 19.3% |
| Immigrants | Iran | 95.8 /100 | #117 | Exceptional 19.3% |
| Immigrants | Guyana | 95.6 /100 | #118 | Exceptional 19.3% |