Egyptian vs Immigrants from Serbia Currently Married
COMPARE
Egyptian
Immigrants from Serbia
Currently Married
Currently Married Comparison
Egyptians
Immigrants from Serbia
47.9%
CURRENTLY MARRIED
94.8/ 100
METRIC RATING
96th/ 347
METRIC RANK
47.0%
CURRENTLY MARRIED
68.8/ 100
METRIC RATING
152nd/ 347
METRIC RANK
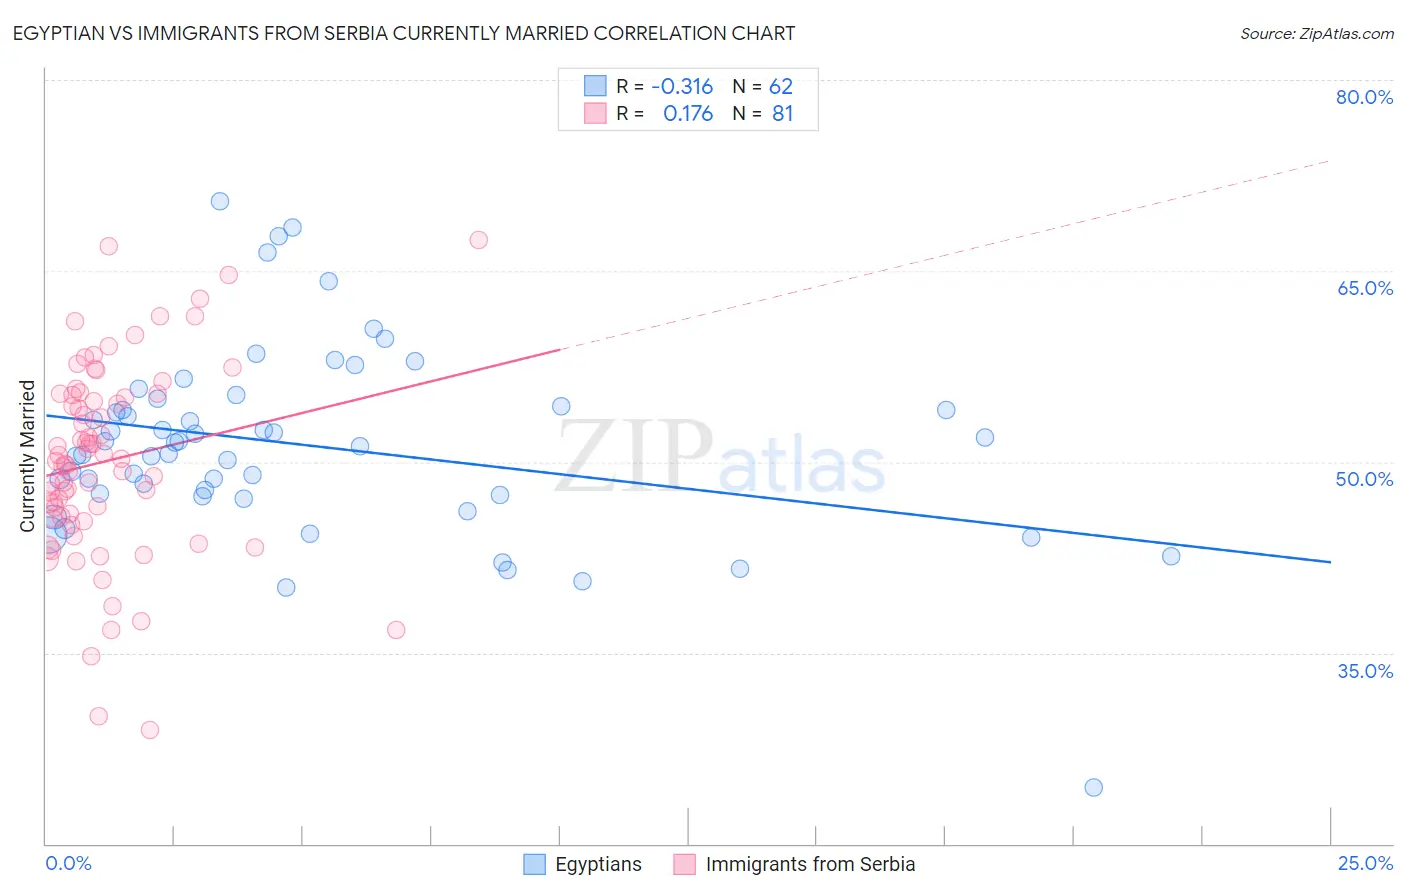
Egyptian vs Immigrants from Serbia Currently Married Correlation Chart
The statistical analysis conducted on geographies consisting of 276,890,367 people shows a mild negative correlation between the proportion of Egyptians and percentage of population currently married in the United States with a correlation coefficient (R) of -0.316 and weighted average of 47.9%. Similarly, the statistical analysis conducted on geographies consisting of 131,746,050 people shows a poor positive correlation between the proportion of Immigrants from Serbia and percentage of population currently married in the United States with a correlation coefficient (R) of 0.176 and weighted average of 47.0%, a difference of 1.9%.
Currently Married Correlation Summary
| Measurement | Egyptian | Immigrants from Serbia |
| Minimum | 24.4% | 28.9% |
| Maximum | 70.4% | 67.4% |
| Range | 46.0% | 38.5% |
| Mean | 51.3% | 50.1% |
| Median | 51.4% | 50.1% |
| Interquartile 25% (IQ1) | 47.4% | 45.6% |
| Interquartile 75% (IQ3) | 54.4% | 55.3% |
| Interquartile Range (IQR) | 7.0% | 9.7% |
| Standard Deviation (Sample) | 7.5% | 7.6% |
| Standard Deviation (Population) | 7.5% | 7.6% |
Similar Demographics by Currently Married
Demographics Similar to Egyptians by Currently Married
In terms of currently married, the demographic groups most similar to Egyptians are Immigrants from Bulgaria (47.9%, a difference of 0.0%), Immigrants from Ukraine (47.9%, a difference of 0.010%), Immigrants from China (47.9%, a difference of 0.020%), Native Hawaiian (47.9%, a difference of 0.040%), and Lebanese (47.9%, a difference of 0.050%).
| Demographics | Rating | Rank | Currently Married |
| Indians (Asian) | 95.8 /100 | #89 | Exceptional 48.0% |
| Americans | 95.7 /100 | #90 | Exceptional 48.0% |
| Immigrants | Bolivia | 95.6 /100 | #91 | Exceptional 47.9% |
| Koreans | 95.4 /100 | #92 | Exceptional 47.9% |
| Lebanese | 95.1 /100 | #93 | Exceptional 47.9% |
| Native Hawaiians | 95.0 /100 | #94 | Exceptional 47.9% |
| Immigrants | Bulgaria | 94.8 /100 | #95 | Exceptional 47.9% |
| Egyptians | 94.8 /100 | #96 | Exceptional 47.9% |
| Immigrants | Ukraine | 94.8 /100 | #97 | Exceptional 47.9% |
| Immigrants | China | 94.7 /100 | #98 | Exceptional 47.9% |
| Immigrants | Sweden | 94.3 /100 | #99 | Exceptional 47.8% |
| Celtics | 94.2 /100 | #100 | Exceptional 47.8% |
| Immigrants | Germany | 94.1 /100 | #101 | Exceptional 47.8% |
| Turks | 93.9 /100 | #102 | Exceptional 47.8% |
| Cypriots | 93.7 /100 | #103 | Exceptional 47.8% |
Demographics Similar to Immigrants from Serbia by Currently Married
In terms of currently married, the demographic groups most similar to Immigrants from Serbia are Immigrants from Venezuela (47.0%, a difference of 0.010%), Albanian (47.0%, a difference of 0.010%), Arab (47.0%, a difference of 0.010%), Spanish (47.0%, a difference of 0.030%), and Chilean (47.0%, a difference of 0.040%).
| Demographics | Rating | Rank | Currently Married |
| Immigrants | South Eastern Asia | 72.9 /100 | #145 | Good 47.1% |
| Carpatho Rusyns | 72.6 /100 | #146 | Good 47.0% |
| Immigrants | Argentina | 72.0 /100 | #147 | Good 47.0% |
| Cambodians | 70.4 /100 | #148 | Good 47.0% |
| Zimbabweans | 70.1 /100 | #149 | Good 47.0% |
| Immigrants | Turkey | 70.0 /100 | #150 | Good 47.0% |
| Chileans | 69.8 /100 | #151 | Good 47.0% |
| Immigrants | Serbia | 68.8 /100 | #152 | Good 47.0% |
| Immigrants | Venezuela | 68.6 /100 | #153 | Good 47.0% |
| Albanians | 68.6 /100 | #154 | Good 47.0% |
| Arabs | 68.6 /100 | #155 | Good 47.0% |
| Spanish | 68.1 /100 | #156 | Good 47.0% |
| Immigrants | Switzerland | 67.8 /100 | #157 | Good 46.9% |
| Cherokee | 66.8 /100 | #158 | Good 46.9% |
| Iraqis | 66.4 /100 | #159 | Good 46.9% |